The Mandelbrot set and how to make it.
Background
As many other fractals, the mandelbrot set is created using a recursive function and an ending condition, where the recursive function gets executed until the ending condition is reached. The general process looks like this:
1. Take input conditions x⃗ and create an empty variable z⃗
2. Calculate the recursive function of x⃗ and z⃗
3. Store the result of 2. in z⃗
4. Check if x⃗ fullfills the ending conditions if not go back to 2.
But now back to the special case of the Mandelbrot set:
Input
In this case the input conditions are the coordinates on screen scaled by the zoom-factor.
Recursive Function
The function is f(x⃗, z⃗) = x⃗ + (z₁·z₁ - z₂·z₂, 2·z₁·z₂)
For those who know complex numbers:
If x⃗ is intepreted as x=x₁+x₂i and z⃗ is interpreted as z=z₁+z₂i, then the recursive function is actually quite simple: f(x, z) = x + z²
Ending Conditions
The recursive function used in the mandelbrot set tends to push things towards infinity pretty fast if they ever get outside a certain radius around (0, 0). That behaviour isn't really interesting. That's why the most common implementation just checks if the point z⃗ is outside a radius of 2 around (0, 0).
There is also a secondary condition which is used to limit processing time. It just tells the program to stop after a certain amount of iterations of the recursive function.
Output
What's finally getting displayed is the number of iterations it took to reach the ending condition. The number of iterations can either be used as hue to generate a color, or used for any other color scale.
In case the second condition was reached, the pixels are just colored black.
Results and Images
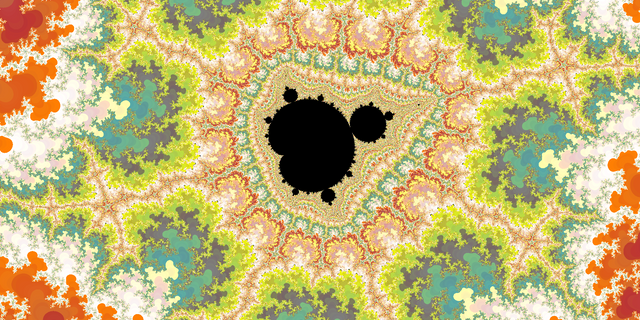
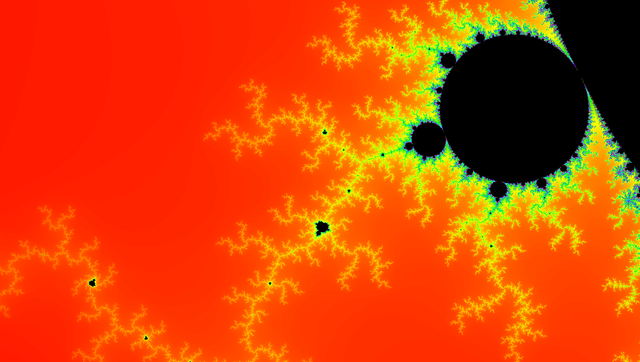
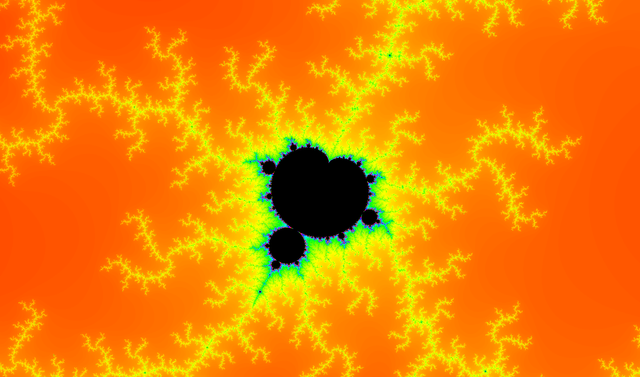
The image at the top was actually zoomed in quite a bit and used a custom color scale. Here are some further images of various zoom levels and color ranges:
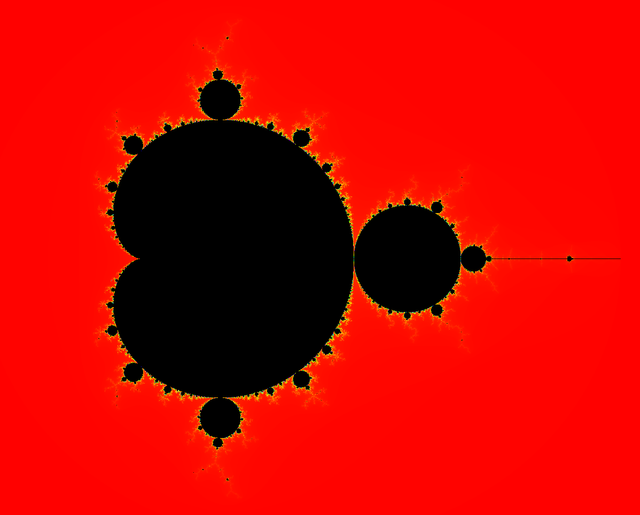
No zoom, hue color range:
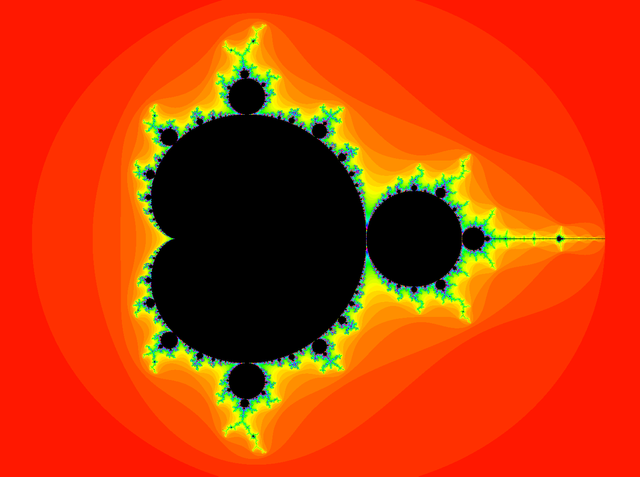
No zoom, hue color range, higher contrast than above. Here you can easily spot the unique iterations:
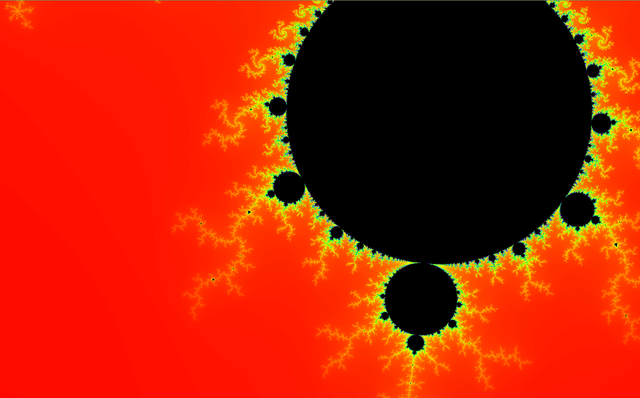
zoomed in on the bottom bulb. Here you can see interesting patterns appear from the bulbs. Those small black dots in these 'antennas' are actually smaller copies of the mandelbrot.
Zooming in further reveals even more details:
Zooming in on one of the copies reveals that it is slightly distorted:
Conclusions
Although the may not look so interesting at first glance, it contains a surprising amount of detail when taking a closer look.
Especially considering from what simple function all this is generated.
If there is interest in this topic, I'll make some more posts on other fractals and variations on the concept.
If there is interest in my source code, I'm willing to provide that, too.
