WHAT ARE STOCK INDICES AND THE CORONAVIRUS IMPACT
What is a Stock Index?
A Stock index is a statistical measure which represents the value of a group of stocks. There are different methods in which this value is calculated which is discussed in a section below. Stock indexes are often used by investors as a gauge of how a market or section of the market is performing in the respective economy of the country listing the index. Indices can be measured regionally, nationally and globally.
Examples of Some of the National Major Indices are as per below:
USA:
Dow Jones Industrial Average (DJIA)
S&P 500
NASDAQ 100
Europe:
UK – FTSE 100
Germany – DAX 30
France - CAC 40
Spain – IBEX 35
Italy - FTSE MIB
Japan:
- Nikkei 225
Methods of the price calculation for indexes/Measurement
- Broad Based Index– A Broad based index measures the performance of a group of stocks or a whole market. S&P 500 is an example of one of the largest broad-based indexes with 500 stocks included and the Dow Jones one of the least with 30 stocks. Price calculation can vary however the goal is to have a figure to utilise as a benchmark for viewing average price movement of a group of stocks over a time period.
- Price Weighted Index– An Index using this method tracks changes in a particular stock’s price per share which in return allocates a greater weight for companies which have higher stock prices. In simple terms by adding each individual stock in the relative index and dividing by the total number of companies included will produce a value, therefore companies with higher stock prices have a more significant effect. The Dow Jones is an example of a price-weighted index.
- Market Value Weighted Index/Capitalisation Weighted Index–This index tracks the proportion of a stock in relation to its market cap also known as market value. The market cap is calculated by multiplying the price per share with the shares outstanding per company, the market cap per company is then divided by the sum of all the market caps involved in the index leaving a percentage weighting of each company. Companies with a larger market cap will have a greater influence. NASDAQ and S&P 500 are examples of this calculation.
- Performance Based Index–An index of this type includes dividend payments, capital gains and any other cash pay-outs to stockholders, the sum of these additional figures is added to the net share price prior to calculation of an index return. DAX 30 is an example of this type of index.
- Composite Index–This type of index is a large group of equities/securities or can be an average of multiple indexes. The New York Stock Exchange is an example of this as it follows all stocks listed on this exchange. NASDAQ Composite is also an example of this tracking over 3300 stocks.
What moves the price of an index?
- Company Announcements – Changes to company structure and personnel changes in positions of employment
- Financial Results–Profits and losses declared, however, this should also be considered alongside company debt, re-investment and the market growth
- Economic news–Interest rate announcements, Non-farms payroll, GDP, Consumer Price Index & Purchasing Managers Index
- Country relations– Health of relationships between countries can have a significant impact on imports and exports along with any charges included
- Commodities– Some indexes contain more commodities than others, therefore, the impact varies
- Index Changes– Companies can be swapped or added which can cause price fluctuation
Investing in Indexes
As discussed in sections prior, indexes are a measure of the market and therefore cannot be invested in directly however there are options available which are detailed below:
- Index Funds – This type of fund aims to mimic a basket of stocks in a particular index. There are usually lower charges and fees incurred in comparison to mutual funds which can incur higher charges from fund managers/companies for managing the portfolio. Index funds provide a more cost-effective solution as opposed to investing in each individual stock listed within an index.
- Exchange-traded funds (ETFs) – The goal is similar to index funds in that It tracks and mimics a certain index however ETF’s can be traded like a stock, buying or selling as appropriate.
Advantages and Disadvantages of Indexes/Index Funds
- Advantages– Indexes can be a key indicator for the overall health of the market and trends which are occurring, this, in turn, can provide investors with a quick method of making more informed decisions and comparing an investors portfolio to the rest of the market. The lower fees involved with index funds as mentioned earlier also make investing in them a more attractive prospect.
- Disadvantages– It is argued that the methods in which the numerical values are calculated either by using a price-weighted system or market capitalisation, allows for too much bias in respect to larger companies given a much more significant weighting. Indexes also swap companies, an example of this is during the 2008 crash where AIG stock plummeted but was swiftly changed with Kraft Foods resulting in the Dow upholding a higher value. In relation to the 2008 crash, Index funds followed the market trend resulting in significant losses, however, if there were a fund manager as is this case with mutual funds, some of the risks could have been hedged or changed positions to cash.
BOOK A LIVE TRADING SESSION AND LEARN HOW TO TRADE THE WORLD'S FIVE TOP INDICES!
What are The Dow Jones, S&P 500 & FTSE 100?
Dow Jones Industrial Average (DJIA)
The Dow Jones was established by Charles Dow in the year 1896, at this point in time the number of stocks included was 12. To calculate the average the sum of the closing price of each company was divided by the total number of stocks included in the index. The Dow Jones is the second oldest index to the Dow Jones Transportation Average which was created in 1884.
The Dow Jones now tracks the 30 largest publicly owned companies trading on the New York Stock Exchange. The Companies included are as per below:
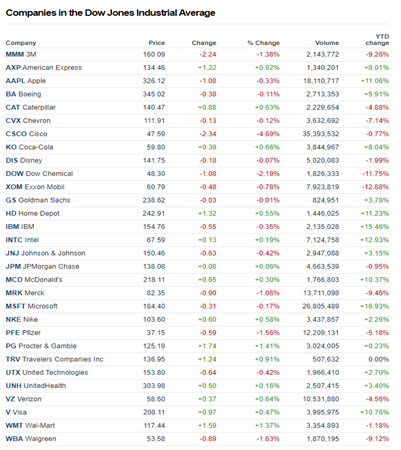
In 1896 the calculation for the average was simple however as more companies were included, dividing by the total number of companies involved didn’t give an accurate representation for the growth of companies in comparison to their price per share. Looking at the table above for an example a $5 increase in share price for Coca-Cola would carry the same weight as a $5 increase for Apple if the sum of all companies were divided by 30. Another example could be Coca-Cola Increasing by $5 and Apple Decreasing by $5 which would negate each other if dividing by 30. Simply dividing by 30 doesn’t take into account the percentage weighting of companies in the index, the Dow Divisor was introduced to maintain the true value of the Dow and keep continuity especially when considering stock splits and inclusions of different companies.
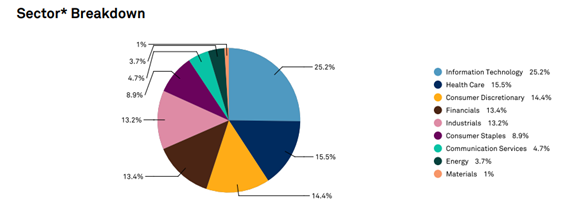
Breakdown by Sector DJIA:
S&P 500
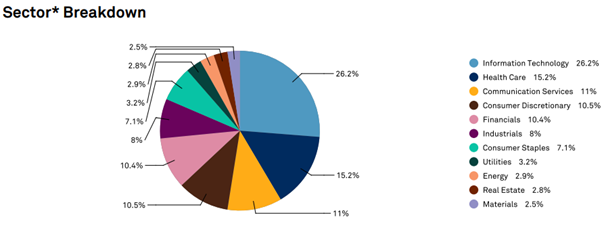
The Standard & Poor’s 500 is an index following 500 of the largest US U.S publicly traded companies, it uses the market capitalisation to produce its value. This index is viewed as a key indicator of health of the US stock market due to the fact it tracks between 70-80% of the total market capitalisation for the US stock market.The S&P 500 dates back to 1923 and at that time included 223 companies covering 26 industries.
The below chart details which sectors make up the S&P 500
FTSE 100
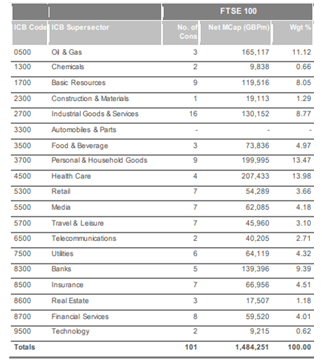
The FTSE 100 tracks the 100 largest publicly traded companies traded on the London Stock Exchange. Like the S&P 500 market capitalisation is used again tracking around 80% of the total market capitalisation for stocks on the LSE. The FTSE was created in 1984 and is widely followed as an indicator for market health for stocks listed on the LSE.
Breakdown of the sector as per below:
How has Covid-19 impacted the US & UK Economies?
The UK economy has been impacted significantly during the Covid Outbreak. Almost all aspects of the economy had to be shut down or drastically reduced to suit new social distancing measures in place which were announced on 23rd March 2020.
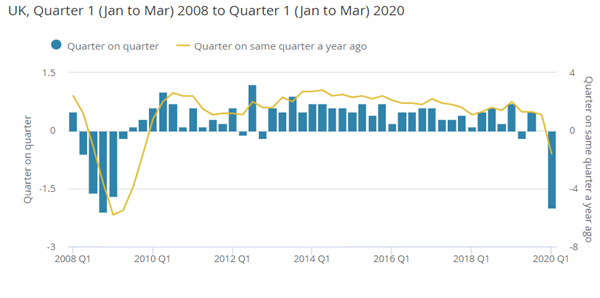
In relation to Q1(January>March), 2020 GDP was estimated to have shrunk by 2% which is the biggest fall since Q4(October>December) 2008. The 2% reduction in GDP also accounts for a monthly 5.8% fall in monthly GDP which was the most since records have been maintained in 1997.
See below for a graph illustrating the fall in GDP:
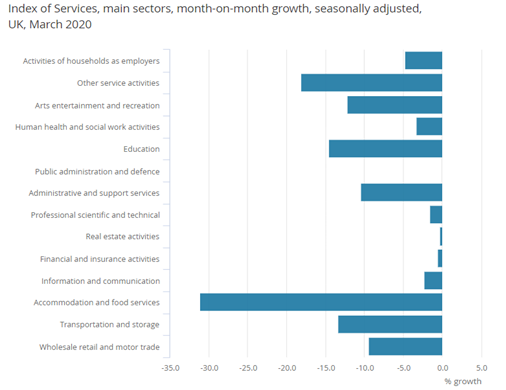
See below for a chart depicting a fall in services during March 2020:
During the Covid period schemes have been to help support workers. Over 8.4 million workers are under the furlough scheme with subsidies claims rising to £15 Billion. Self-employed worker claims have also risen to over 2.3 million totalling around £6.8 Billion.
How has the US economy been affected by Covid?
The US economy has also been significantly impacted by the virus and the below will touch on key aspects of the economy.
Real GDP reduced by a 5% annual rate. The below illustrates the drastic impact of closing the economy down to reduce the transmitting the virus. The decline was the largest quarterly decline since the 8.4% drop in quarter four of 2008.
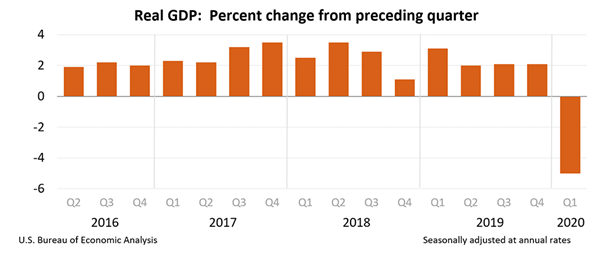
The graph below portrays the impact on goods and services:
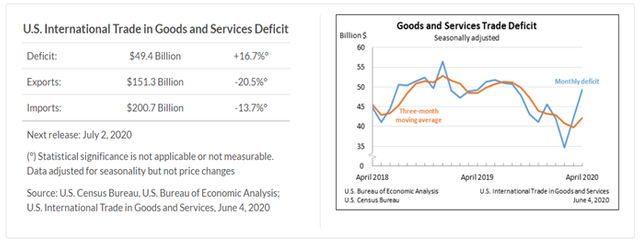
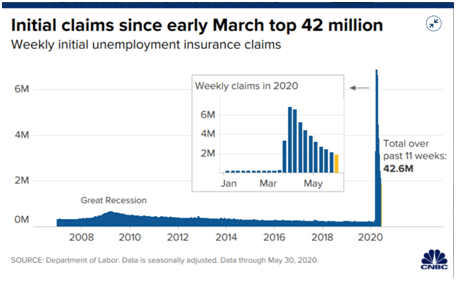
Unemployment has also been a huge issue growing weekly, in the US. Since 2009 the jobs created total to around 22.4 Million, In 5 weeks all of the jobs created since 2009 were wiped out.
See below for the current outlook and increasing claims amounting to 42.6 million.
BOOK A LIVE TRADING SESSION AND LEARN HOW TO TRADE THE WORLD'S FIVE TOP INDICES!
How has the FTSE100, Dow Jones & S&P 500 been affected by coronavirus?
FTSE 100
The FTSE 100 had a huge drop in value as seen on the chart below. On the 21st of February, the level was 7409.13 and this fell to 5190.78 on the 20th March which is the trough highlighted in yellow on the chart below.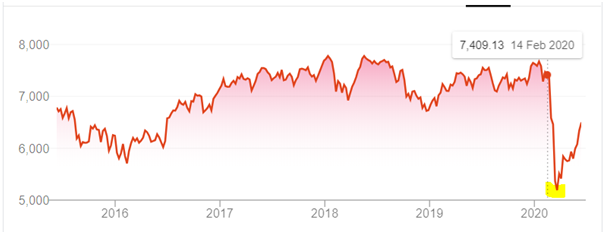
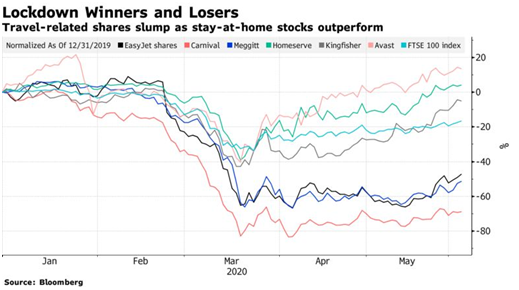
As the pandemic has continued this has had a larger impact on some companies and has proved to be a benefit for others. 4 companies have recently exited the FTSE 100 and dropped into the FTSE 250 of which are EasyJet, Carnival(Cruise Company), Centrica(British Gas Owner) and Meggitt(Aerospace Engineering Company).
What are the key reasons for removal?
- Easyjet – Lack of air traffic due to travel restrictions
- Carnival - Shares dropped 60% as travellers were stranded and quarantined on a ship for multiple weeks
- Centrica – This company has been on the verge of exiting for a while due to cheaper utility providers taking its customer base along with the impact of lower oil and gas prices cutting profits gained.
- Meggitt – This company was already under review as two Boeing 737 planes were grounded after two incidents and with the airline industry at a standstill less componentry and parts being required.
Companies Promoted to FTSE 100:
- Avast(Software Security Group) – This company had been performing prior to Covid and was on course to join. Initially at the beginning shares did suffer a sell-off however as the lockdown length continued and the need for people to work from home continued, this meant people begun investing in more security and anti-virus software.
- GVC(Sports betting & Casinos) – Shares in betting firms such as Ladbrokes. At the beginning, shares plummeted as sports were postponed worldwide meaning there was far less to bet on. However, as more people were at home this led to new customers using online casinos along with slot and poker games which then provided an uplift.
- Kingfisher – This firm made strong gains as DIY stores were allowed to remain open such as B&Q. Again, with people stuck at home, this led to investment in their own properties.
- Homeserve(Home Repairs and Installation)– This company was performing before Covid and although there was an initial sell-off, more customers begun singing up as the lockdown continued.
The chat below illustrated the points mentioned above:
S&P 500
The S&P 500 was also significantly impacted by a coronavirus, on the 14thof February the value was 3380.16 which reduced to 2304.92 on the 20th March highlighted on the trough below.
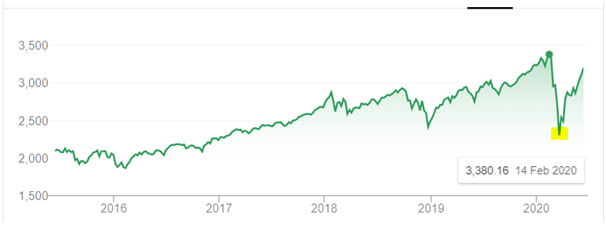
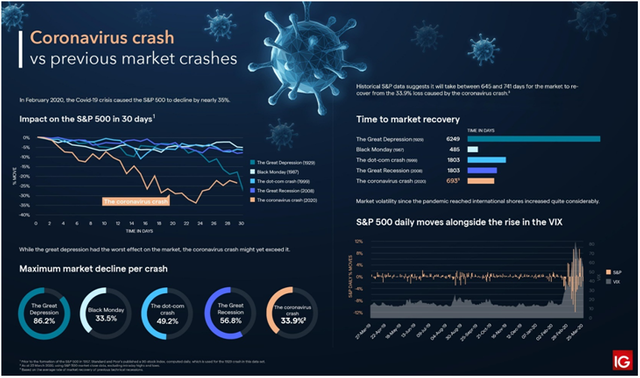
The chart below details the effects of the coronavirus crash had on the S&P 500 in relation to other significant market crashes. In February S&P 500 crashed by close to 35%, the drastic affect is shown below on the 30-day chart impact.
S&P 500 Winners and Losers:
Some of the worst losing stocks in the S&P 500 are as follows:
- Apache Corp(Oil & Gas) – In April this stock was down 83.7% due to the issues at the time around oil prices along with supply and demand
- Other Energy stocks have also had a huge fall in April such as Marathon Oil down 75.9%, Noble Energy 73.4%
- Cruise operators such as Norwegian cruise line down by 81.2% and Royal Caribbean by 75.9%
Examples of stocks which gained during this period within the S&P 500 are as below:
- Health-related stocks such as Gilead Sciences searching for a Covid vaccine and Clorox who make disinfectant wipes increased by 15% and 13% these figures being recorded in April
- NortonLifeLock – gained by 27% in April as the company deals in cyber security
- Netflix – Up by 16% in the first quarter
Dow Jones
As have the other indices mentioned the Dow Jones reduced dramatically. On the 14th February, the value was 29398.08 dropping to 19173.98 on 20th March highlighted yellow on the chart below.
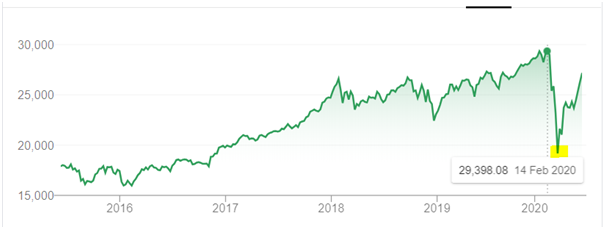
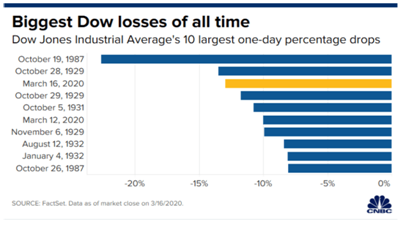
In March The Dow dropped by 3000 points suffering the worst drop since the Black Monday market crash in 1987 and this was after the Federal Reserve had begun its stimulus campaign.
See below for a comparison of the Dow Losses throughout history:
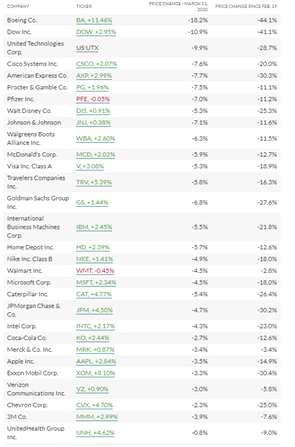
Stocks which reduced in value during Covid listed on The Dow:
As of the 11th of March, some of the largest moves included Boeing, American Express, Walt Disney, Goldman Sachs, Chevron Corp and Exxon Mobile. All these reductions were due to a drop in investor confidence, isolation/social distancing and further unemployment claims leading to a drop in consumer spending and borrowing from banks.
Current Outlook and Future Implications
During the Covid-19 pandemic, there have been huge implications worldwide and for stocks. Oil prices turned negative for the first time in history, large firms have filed for bankruptcy such as JCPenney, Gold’s Gym, True Religion Apparel& CMX Cinemas. Multiple airlines require a bailout from the government such as Lufthansa (€9bn). Unemployment and claims as such have reached new heights and the Stimulus packages are having to continually increase as the pandemic continues.
Currently, stocks are on the rise meaning so are the indexes and this can be seen above. This is due to new investor confidence in economies re-opening, huge stimulus packages such as the ECB $680bn increasing the total to 1.35 trillion euros. There is confidence in pharmaceutical companies creating a vaccine however this is all a very positive outlook. Looking from another angle a lot of the confidence involved isn’t proven and there are fractions which are beginning to occur, for example, China aiming to implement new security laws over Hong Kong, the US already had made claims regarding China and withholding information over Covid, however, this has now increased tensions as the US are opposing the new laws and has threatened to blacklist Chinese companies. In retaliation, China halted U.S farm imports. The UK has also got involved by opposing China and offering 3 million people from Hong Kong refuge in the UK and also opposing using Huawei Technologies for the new 5G system. China could now potentially pull plans for building new nuclear power plants and the HS2 rail network. There could be trade war on the horizon which would have huge implications on the worldwide economy and stocks in turn. Another facts which must be considered are the riots and protests over George Floyd’s death, coronavirus has no vaccine currently and masses are congregating within close proximity without wearing effective PPE, this could be increasing the spread of Covid.
Economies are recessing and governments are attempting to battle this by injecting more money, however, people are in a recessive mindset and many people out of work completely. The threat of a huge recession is very true and could mean stocks make a sharp turn back to the downside.
BOOK A LIVE TRADING SESSION AND LEARN HOW TO TRADE THE WORLD'S FIVE TOP INDICES!
Hopefully, you have enjoyed today’s article. Thanks for reading!
Have a fantastic day!
Nisha Patel
Live from the Platinum Trading Floor.