How to Select the Right Indicator Period
When we focus on one indicator in one trade, there are frequently asked questions about how many indicator periods should be set or used in each pair. Two frequently asked questions are the indicator period used using default settings or traders should use the "tweak" setting?
As a general rule, which should be known and understood easily when the number of adjusted indicator periods enlarges from the default price, the indicator becomes less sensitive to price movements as it is used in a large amount of time to calculate (average) price movements. As a result, we often see the price of "late moving down or up".
Conversely, when the number of periods decreases from the default price, the indicator becomes more sensitive to price movements because it uses fewer periods of time, the time span used is shorter to calculate the data. In this case, we will see the price will be "fast moving up or down".
Let's try by using the RSI indicator on the daily chart of EURCAD below for example ...
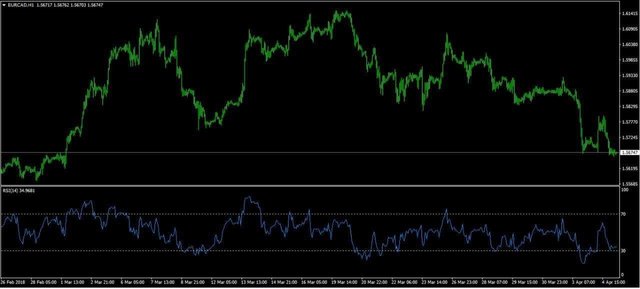
As we already know how to review RSI indicators quickly,
the RSI indicator will give a buy signal when it is below level 30 and then the indicator moves and closes upwards 30. The sell signal occurs from the RSI indicator when the price has been above 70 and then moves and closes below the 70 level.
The first RSI indicator in the graph below is the standard by using the standard period of 14. Based on the above criteria, buy or sell signals are generated in each green circle with a total of 6 signals.
In the second version of the indicator period below we have shortened the number of periods until it becomes 9. As can be seen, the indicator becomes much more sensitive and the difference in the number of generated signals is easily visible with the total on this version is 10 signal given.
If we compare the signal to the price movement in the graph, we can
see that some valid signals will generate temporary pips
other signals only short-lived or often called fake entry signals can be seen on the graph.
The last version of the RSI indicator set is the period of 25. We can see the smoothing effect that the increase in the number of periods it has. Visible, we note that not one signal is generated during the time covered by the graph. When the signal does not appear, however, it will have a greater degree of the reliability of either the 9 or 14 periods.
After all of the above, a trader can manage whatever period they find and best to become their own trading style and strategy. This can be achieved through experiments with various time frames and forward results.
For long-term trades, the number of periods may increase
increased. The little trading signal will keep the resulting signal going
has a greater degree of reliability. (Just like using long-term charts versus short-term charts). Conversely, if you reduce the number of periods then the trading signal will be generated more but they will have no sufficient reliability or lower reliability levels.
So everything is returned to each trader, which period will be
you choose?
Congratulations! This post has been upvoted from the communal account, @minnowsupport, by zulfikar-fx from the Minnow Support Project. It's a witness project run by aggroed, ausbitbank, teamsteem, theprophet0, someguy123, neoxian, followbtcnews, and netuoso. The goal is to help Steemit grow by supporting Minnows. Please find us at the Peace, Abundance, and Liberty Network (PALnet) Discord Channel. It's a completely public and open space to all members of the Steemit community who voluntarily choose to be there.
If you would like to delegate to the Minnow Support Project you can do so by clicking on the following links: 50SP, 100SP, 250SP, 500SP, 1000SP, 5000SP.
Be sure to leave at least 50SP undelegated on your account.
We recommended this post here.