USDJPY Trading Strategies & Technical Analysis June 9, 2023 | Forex Trading Technical Analysis
Forex Trading Technical Analysis

Hello Traders I'm going to be analyzing the USDJPY
hello, Traders, today is Friday, June 9th and I'm going to be analyzing the US dollar again starting on the monthly and working my way down to the one-hour time frame so on the dollar again monthly I still think this looks like a big ABC curtain if this is a big ABC question then this move up is going to be cut into this move down and it's going to make a lower high and end up continuing the downtrend so we want to keep an eye on that

I also do see the possibility that the Yen just keeps on driving this up because a lot of the young pits look like they have a long ways to go to the upside
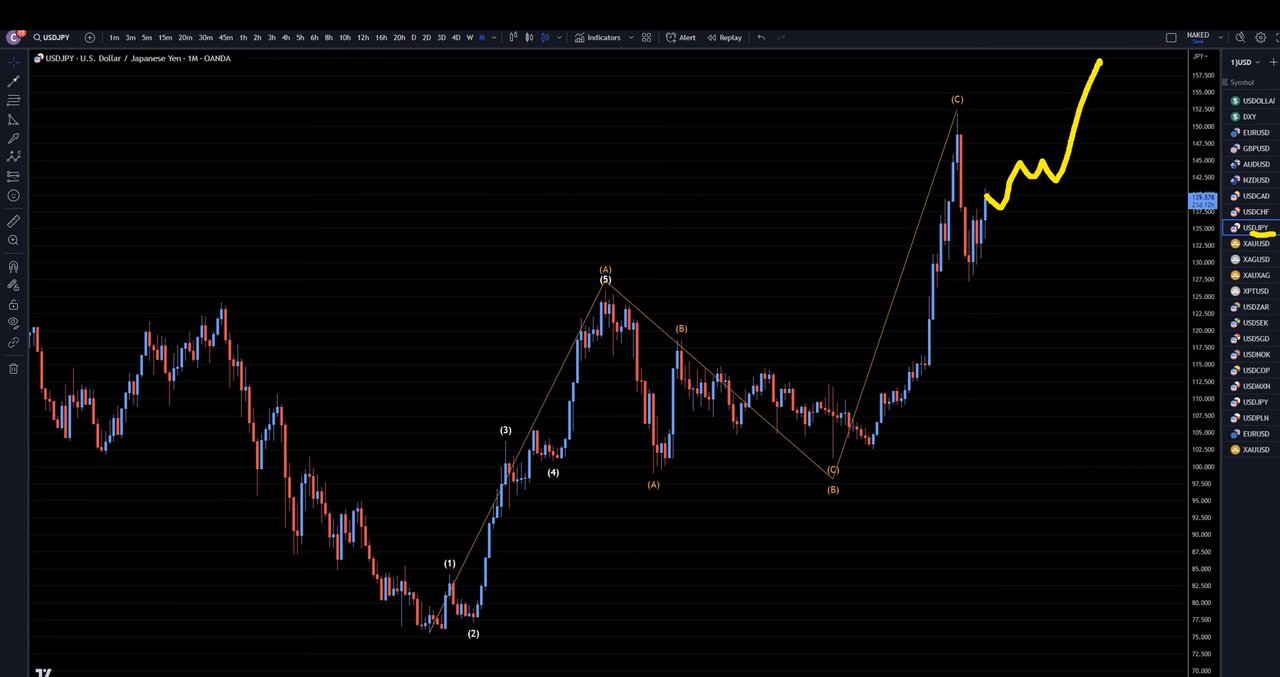
if they keep going up then this is probably going to keep going up also but for now, I am looking at this move up as an ABC to this move down I think this move down is up one I still think this could be an ABC up if it bounces off to 61.8 makes it nice and positive move-down takes out structure we'll know that that's the end of an ABC cutting and we'll just keep on going short for the continuation of the downtrend but until I see that the the downside I'm looking for Longs on sort of time frames and like I said it very easily could just keep on drifting up luckily we'll be looking for Longs and an uptrend anyways on short of time frame so it is not going to matter to us so going down to the Daily time frame,

Daily time frame it looks like we may have ended another three-way pullback and I think that we're probably heading up to at least a 61.8 percent FIB level if it does go up to that level then make an impulsive turn with a break of the structure that's what will tell us that we had the end of a wave C if it does go up and it doesn't break the structure it goes up maybe makes a bounce but then doesn't break structure then we'll just keep on going long and an uptrend

Taking it down to the four-hour time frame four-hour time frame is where you can see the downtrend which I think is think this is an ABC a b and I think this is a wave C made three ways down to the 61.8 percent FIB level nice and pulsive move up definitely looks to me like it ended a cutting and it probably is going to go up and it probably is going to break this level and most likely go up to at least that 61.8 percent filet I was just sewing on The Daily time frame so let's head down to the four the one hour

the one-hour time frame now you can see this trend for wave C then you can see the impulsive move up with a break of structure that right there is exactly what we need to look for the end of a trend for the end of a wave C when we know that the wave C is over we also have a pretty good idea that the whole ABC question is complete and I bet that we are now continuing the uptrend so I'm looking for Longs I'm looking to go along at any ABC Corrections that I may see along the way

