Forex Analysis Report 10-5-18...USD/JPY...Momentarily Range Bound, But Potential About To Break Out

On Wednesday, the 10-year yield gained more than on any day since the November 2016 presidential election. On Thursday, yield on the US 10-year Treasury rose above 3.2% Thursday morning. That's the highest it's been since July 2011.
The USD/JPY currency pair has traditionally had a close correlation with U.S. Treasuries. When Treasury bonds, notes and bills rise, USD/JPY prices weaken. When interest rates are heading higher, the U.S. dollar will move higher, the USD/JPY prices will strengthen.
So with Bond yields and interest rates rising, expect the USD/JPY to rise…well, not necessarily. During risk-off times, the only two currencies to appreciate relative to the USD are the Yen and the Swiss franc. For example, yesterday, when the DOW dropped 300+ points, the USD/JPY dropped as well.
So where the USD/JPY headed next, lets go to the charts to find out?
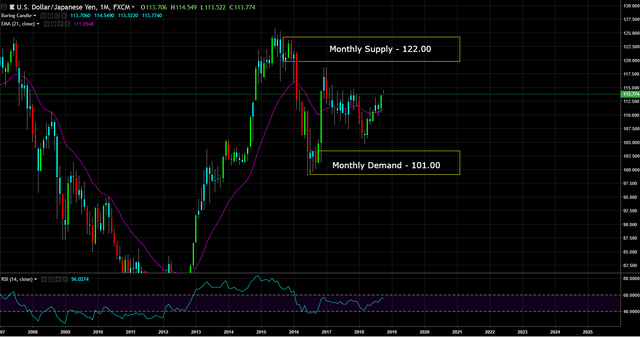
Monthly Chart (Curve Timeframe) – monthly supply is at 122.00 and monthly demand at 101.00.
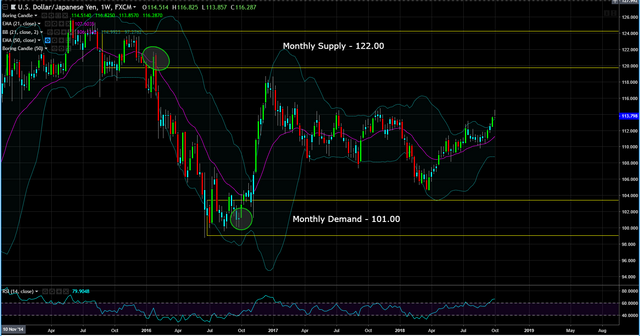
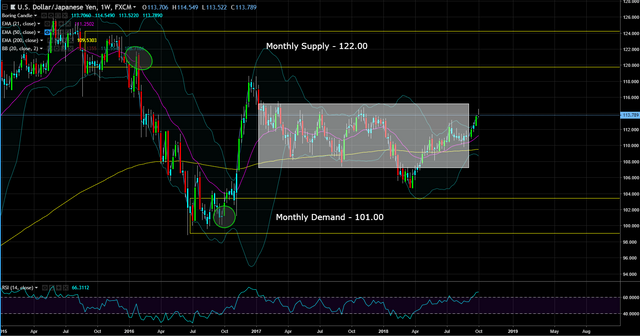
Weekly Chart (Trend Timeframe) – the trend is range bound. No really good weekly demand or supply zones until price get to the monthly zones as indicated in green circles.
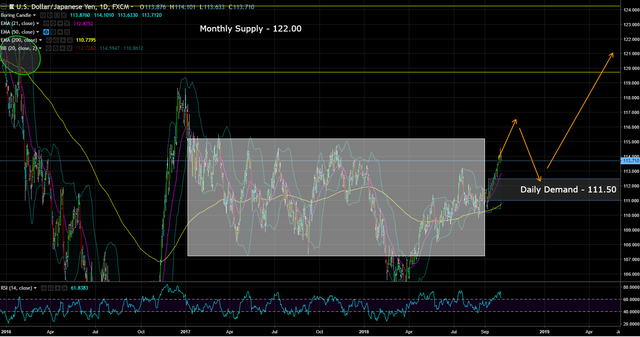
Daily Chart (Entry) – here's a closer look at what I was seeing on the weekly chart. The white rectangle represents the no trade zone,
One potential set-up would be if price can break out to the upside, a pull back into what would now be a daily demand zone would be a good place to go long to at least the 117.00 - 118.00 level.
This post is my personal opinion. I’m not a financial advisor, this isn't financial advise. Do your own research before making investment decisions.

Published on

by rollandthomas

Agree on the long term trend. Bit of congestion around that 114 area and US coming off may see JPY strengthen. Important long term breakout in the Nikkei and Topix also suggests it goes higher longer term. Have a look at the long term Topix chart, looks pretty bullish as long as support holds. https://steemit.com/trading/@technicaltrader/nikkei-225-topix-the-bigger-the-base-the-higher-in-space-significant-rally-ahead
I'm not familiar with Topix, but I like the inverse relationship between the yen and Nikkei. I like your analysis on the dollar as well...all supporting going long usd/jpy.
The X factor will be the US equities...the long term trend is still up.
Nice chart i will follow your trak and make profits in the way ;)