[Daily Forex Trading] Gold & Forex Analysis June 22
Brief analysis of gold trends and some currency pairs on H4 time frame
XAU / USD
first.
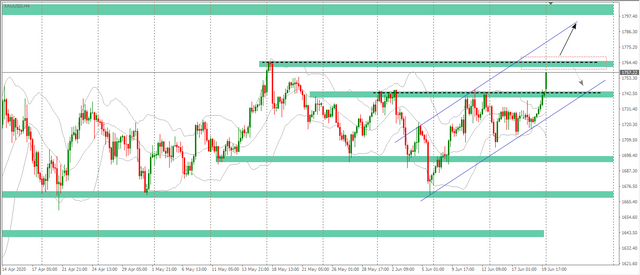
The last session of the week witnessed the recovery of gold but the price could not escape the 1740 area. Something is coming, Bollinger bands on H4 are opening very wide, and daily bands also have a relatively long and narrow accumulation segment, waiting for a breakout. Many-year highs - 1760 levels - are approaching. With the current upturn, we are temporarily abandoning the sell strategy in the zone of 1760 because it is quite dangerous, instead waiting for the area to be broken down and buying, if this happens, it is very likely that will go up to 1800, in line with the medium-term view.
In the case of a session where prices could not penetrate / create a false breakout in the 1760 zone, we would consider selling.
USD / JPY
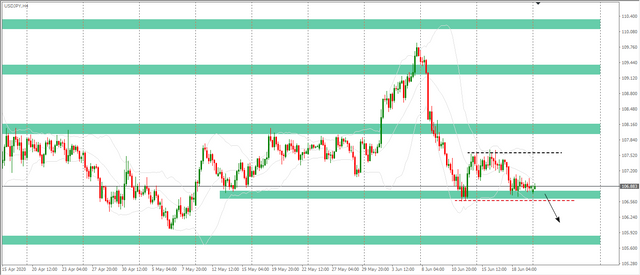
The price has not changed much and is still accumulating around the support area of 106.7, the lack of buying power around this price area is increasing the possibility of price breaking the bottom. Continue to observe and hold the short position, supplementing the position when there is a reliable breakdown signal.
EUR / USD
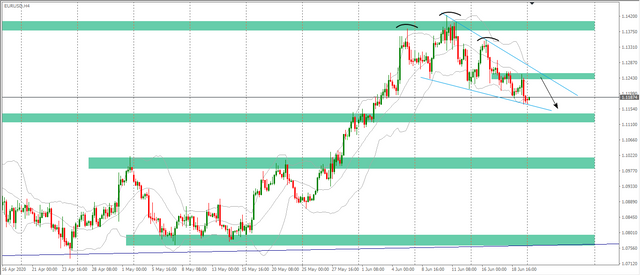
Although the head and shoulders reversal pattern has been completed, the decline is not as strong as expected, the current price is forming a declining accumulation zone of wedge pattern, you need to pay attention to the breakout of the This model, it is a medium term model. In the short term, we can still follow the downtrend, hold short positions and add short positions at the upper boundary of 1.125 and the short-term target is 1.110.
GBP / USD
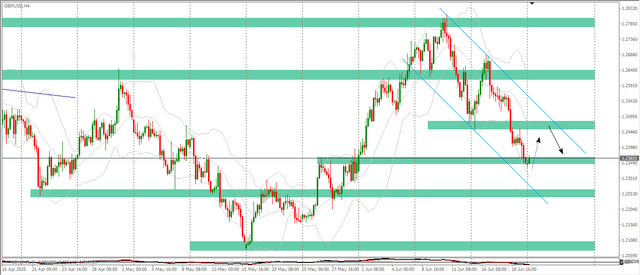
Price is still moving in the direction of prediction and the target around 1.23 also seems to be approaching, you may consider escaping short orders or moving SL, because the possibility of price adjustment is increasing. The opportunity to return to the downside will come when the price corrects to the upper resistance areas like MA20 or 1,245.
USD / CAD
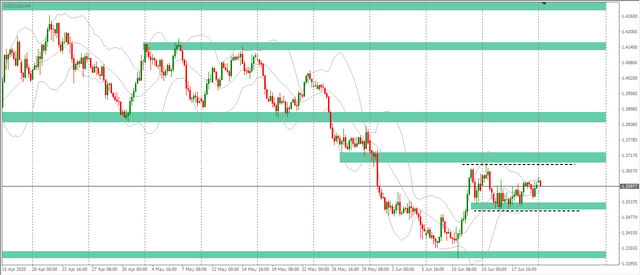
Unlike the above pairs, #USDCAD doesn't have much to say, we continue to observe the current range and wait for the breakout signal to determine the next direction of the price.
AUD / USD
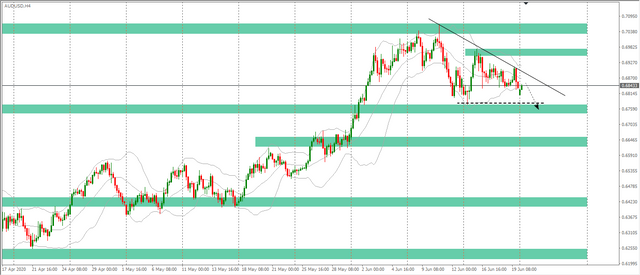
Price is still adhering to the downtrend line, supportive models have also appeared, such as bearish engulfing on H4 and pinbar on daily. Continuing to expect the price will test the bottom of 0.678. If this zone is broken successfully, the fall is likely to extend to the lower band above the daily zone - 0.665