Foreign Exchange Market Trading 101
Foreign Exchange Market 101
So far my forex trading has been around 19% gain since late December. Unfortunately, due to a misunderstanding, I had to reset everything, but I'm posting the myfxbook so you can verify. Long story short I am starting a Money Account Manager which doesn't allow me to use my previous account's trading history. I have been trading the foreign exchange market for about a year now, and I am by no means an expert yet, however, I have some extensive knowledge of what works and what doesn't. Hopefully, by the end of this article, I can show you some important technical and fundamental highlights that you should look for when trading.
Technical Analysis
[source]
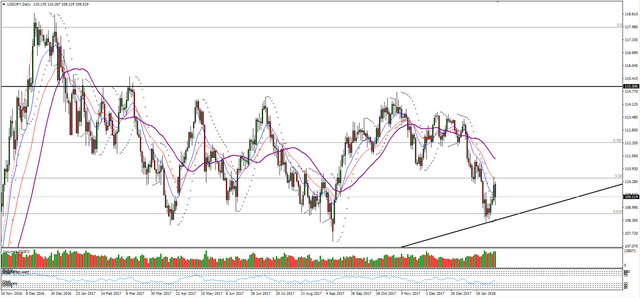
This is the daily chart for USDJPY the following week after the trade was complete (I forgot to capture the image when closing my position). I always close positions on Friday. Over the weekend there is always the possibility to gap over your stop loss. I once lost 15% account value on gold alone by holding it over the weekend. Rekt!
I saw my opportunity to buy in on Friday the week previous, but I wanted to see the opening price on Sunday. Wouldn't ya know it the price opened right on the 0.618 fibonacci level above the macro trendline? I live for sexy trades like these. Let me explain...
There are a handful of indicators that I use to make my decision when it comes to trading. Most often than not the "technical indicators" that are sold for hundreds and thousands of dollars by "experts", "gurus", "market whisperers" or other forms of nonsensical pseudo-clandestine nomenclatures are complete trash and are only created as a method of producing steady income for traders who cannot trade themselves. These members of society will go to great lengths to sell their flawed concepts.
There are plenty of technical indicators though that are very useful even transcending into the fundamentals. Market Cap, Unemployment, Gross Domestic Product, Consumer Price Index, Oil Futures along with Phillips Curve & Taylor Rule just for starters. I don't expect you to understand how all of these work together or even what they mean. The point is we use indicators all of the time that are used to track specific areas of the market that have probable cause and effect relationships.
I'll start with the real hocus pocus though. There is a sizable sum of money available for the person who can identify why Fibonacci levels have higher propensities to increase trading activity in the markets. My personal hypothesis is hedge funders who use High Frequency Trading sytems (Black Boxes) preset the systems to execute or close their positions based on Fibonacci levels and Moving Averages, but again thats just my personal opinion. These investors are very farmilair with Non Disclosure Agreements so not much is known. It is common knowledge that large investors such as hedge funds don't make all their descisons at once, but they scale their poisitions in and out over time (unless you trade cryptocurrency then rest in pepperonis account).
.."At long as a stock is acting right, and the market is right, do not be in a hurry to take profits".. -Jesse Livermore Trading Rule
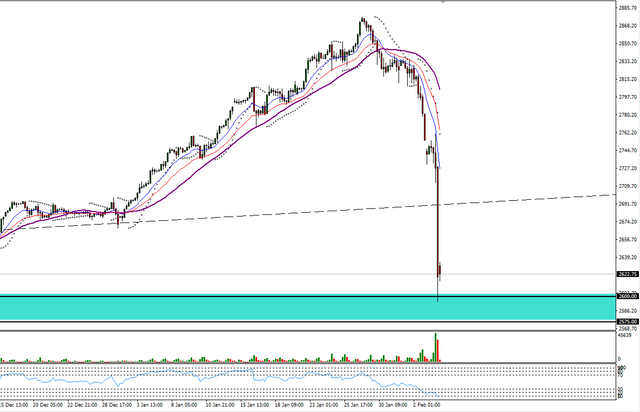
I use Harmonics as a way to get a feel of when market shifts may happen. For those of you who are unfarmiliar with Harmonics levels think about this. You bought at 0.00 in a bullish market and you jump up till 1.00. You want to size your positions in and out because a vertical market is bad news. When you throw a ball hard as shit into the air and it hits some dude it is going to hurt a lot more than if you just gentle chucked it to him. I've included a pretty picture of today's S&P 500 for demonstrative purposes.
[source]
But if you close half of your positions and then rebuy at .382, 0.5, and/or 0.618 then you can size yourself in and out without fucking everyone over. Sometimes you will have markets that move sideways for a while which means that the market is undecided on what it wants to do. The central banks have 2 modes printing money and sometimes they print less money than they usually do. This is due to inflation. If there is too high of inflation then the power of the dollar goes to shit and they have to print more money to compensate. If there is too little of money and they take even more away then the engine stalls and the firms run out of fuel to keep people employed. Instead of making descisions right away they like to move at DMV level speeds and take forever to implement their new policies. Make sense? Well bear with me here (pun was intentional)...
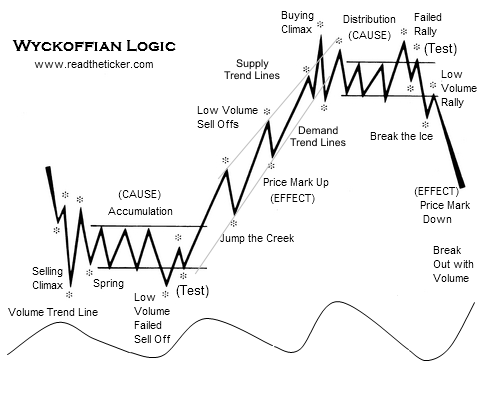
These reversals in the market are what I pay attention to when I'm looking to place my trades. If you haven't read Wyckoff Theory yet I definitely recomend giving it a read. It discusses the events that take place when central banks are looking to enter a change in policy. It can help you identify if a market is entering a reversal or entering a consolidation period to scale in and out. Market structure is easily the most important part of charting your graphs.
The entire point of any technical analysis is to find support & resistance level structures. Floor and Ceilings are the best analogies for this concept. When your indoors the floor is the thing that holds you up and the ceiling is the thing that holds you down. If you break through the floor you will keep falling until you hit another floor.
I like to use stocks to explain this concept because it's simple. Let's say that I start a company and I decide to go public. My financers decide I should have 100,000 shares available. In the presale 20% of the total investors purchase 60% of the total market cap and then when I hit exchanges the rest of the 80% of investors purchase the remaining 40% of the shares. My first quarterly income statement show a loss and some of the weaker investors jump ship. The investors who have smaller accounts are going to cash out first so the price dips a bit, BUT majority of investors decide to hold on. These big investors have now create a new floor and we have now reached supply & demand equilibrium. The supply doesn't change so the only way to change price is demand. The opposite of this is resistance which is running out of investors money and the only way to increase the stocks price is to find new investors who beleive in the company. I don't have a cool picture to explain so heres a heres a nerdy equation instead.
Market Capitalization / Share = Stock Price
In the foreign exchnage market this works similar except instead of companies they are central banks and we trade pairs. The USDJPY pair I want to evaluate if I think the Japanese Yen is going to be stronger or weaker against the US Dollar in the future and by how much. In this trade I made the assumption that the Japanese Yen was going to becoming stronger than the US Dollar by looking at a bunch of scribbled lines on a screen. That makes sense right? WRONG! Deductive vs Inductive reasoning. The cool looking lines on the screen are the outcome of various underlying variables which is why I combine technical analysis with fundamental analysis. Price is always the last thing to change. I will explain in Foreign Exchange Market trading 102.
I would like to make a big shout out to all the dipshits who claim that all you need is technical analysis. I don't care how many times you've charted graphs or how much is in your demo account you will fail if you aren't actually taking time time to educate yourself on why the gears move in the manner they do. You can drive a car for a while and make it pretty far, but if you can't do the simple basic repairs like changing the oil or replace a flat tire then you're going to have to rely on guys who actually know their shit in order to keep driving. Keep selling those indicators and flexing your demo account withdraws "gurus".
So let's start to wrap everything together. When I place trades I don't have a mechanical method that makes sure that I will have a guaranteed chance of winning. If I can keep a steady 60 - 70% win ratio over the course of 2+ years as an active trader than I've acheived mastery. Instead I like to think of my trading rules as plays in a playbook. If you play a game of football and you keep passing every single run you'll never win a game. Instead rate your trade opportunties by how many plays are lined up. If the pair opens up in your trade with a type-1 or type-2 close which you can learn about here from my homeboy Nick from PuriCassar (because he's awesome and I'm trying desperately to keep this succinct), the Relative Strength Index is telling me this is undervalued, it opens above my macro weekly trendline, there is an increase in volume, and we have started to consolidate in price structure then I can guess that this has about a 70% chance of reversing. How do I know it will be 70% chance of reversing? I don't. I chose some random number above 50% that I figured was beleivable. Foreign Exchange Trading is all about guessing close enough to make it look like you know what you're talking about.
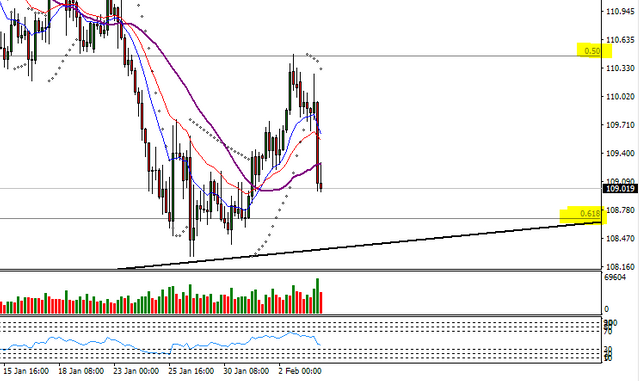
Seriously though this trade triggered all of my spidey senses. I could have been wrong even all of the planets aligned which is why I only place trades with 1 - 2% of my account. This one ended up getting me 5% account win and I only risked 1.5% of my account. Not too shabby and wouldn't you look at where it touched before reversing? On the 0.5 Fibonacci level.
[source]
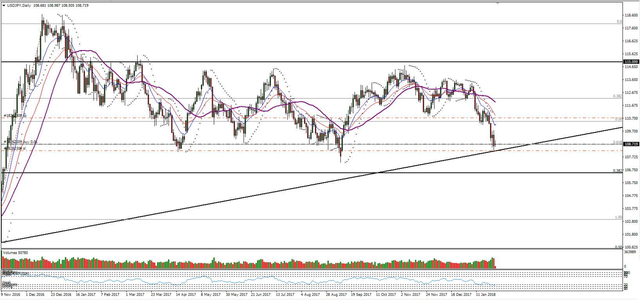
This is the weekly macro chart
[source]
If you like this lesson and you want to see more of it please don't forget to subscribe and upvote this post. I want to continue writing and I will offer all of my knowledge for free. The next article will most likely be Foreign Exchange Trading 102 which will cover fundamental analisys which breaks down in detail what the central banks see when they evaluate economic policies.
Now that is one comprehensive article. I'm interested in the difference between MA and EMA. What, why and how?
Moving Average and Exponential Moving Average. There is also Simple Moving Average. It's all in the way that the system generates the chart graphically. It's similar to like how some charts are displayed use logarithmic or linear scale charts. It's all preference however on smaller time frames some trader's prefer EMA because it favors recent price over smoother average price structure.
There’s a ton of good stuff in here mate. Always happy to help out new traders who are willing to put the effort into providing quality content.
See you around!
Thanks! I honestly have trouble deciding which topics I wish to discuss because I have so many ideas to choose from.
So not shown in this article, but when the markets opened up again on Monday the price shot back down to the .618 level. I entered another long position and made a nice side bit of profit. Long term I think this will definitely be a macro bullish trend just looking at what USD is doing, but I don't like to trade long macro trends. Just my observation.