USD/JPY: Bullish Deep Crab
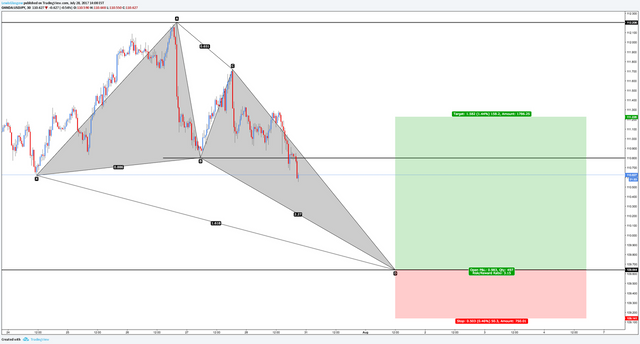
Hello traders, it appears USD/JPY is now forming a bullish deep crab pattern on the 30m chart. This is an excellent opportunity with a potential 150+ pip return!

The measurements for a valid deep crab are detailed below.
B: 0.886
C: 0.382 - 0.886
D: 2.24 - 3.618
X to D: 1.618
I'll be expecting price to stall out once it reaches the D point, this forms on a key level of support!
Keep this setup on your watch list going into a new week.
Click here to view my original post on TradingView.
Don't forget to upvote, resteem and follow me for in-depth market analysis and investing education.
Check out my analysis on trades! this is how to truly understand what the market is doing, and where it is going to go.
Hi Lewis, probably just me but i dont see how you make the most right triangle. Is it supposed to go to the far corner? only from that point are you calculating your profit loss right? sorry if too complex to answer here. cheers anyway!
Hey @attalis, yes it's just a different type of harmonic pattern, the D leg is a very extended price move therefore the shape will be different from others you have seen.
My stop loss is calculated based on the D point completion and my take profit levels are obtained by measuring from A to D using the fibonacci retracement tool, with the ratios 0.382 and 0.618 as the final take profit.
thanks so would you only go long at point D or would you be short now already until it reaches that point. (I hope i am seeing point D correctly as it is quite small ;))
Yes I would wait until price confirms the price level at D, hopefully this will complete by Monday :)