Trading Techniques Using Stochastic Strategies and Breakout Strategies
Whatever the strategy, the investment world certainly has the advantages and risks that must be accepted. So the applicable law is the greater the profit, the greater the risk. Likewise with forex which belongs to the type of investment is quite risky. This has been described in many other articles. For when compared with deposits, mutual funds, or stock of profit potential in forex will be higher, as well as forex trading risk.
Talking about forex trading, it means you should also know about trading strategy information that can be used, and the information you can get through some forex website. This time the online currency will provide information about the two forex trading strategies that can be a strategy choice for you to use, namely Stochastic and Breakout Strategy.
FOREX TRADING USING STOCHASTIC STRATEGY
Stochastic is a simple oscillator indicator that can measure a momentum. This indicator was first discovered in the late 1950s by George C. Lane, so this indicator has been in use for more than 50 years. Until now stochastic is one indicator that is quite popular among traders because it is easy to understand and practice.
As one of the momentum indicator that has the character of oscillator, stochastic can show when price movement has reached overbought condition (oversold) or oversold condition (oversold). When compared with RSI strategy, stochastic has advantages because it has a sell and buy signal.
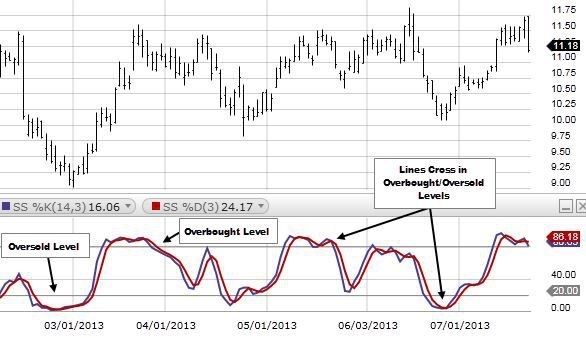
There is considerable variation on this indicator, but traders often have stochastic slow which has two curve lines similar to the moving average. The movement of this curve is limited by levels 0 to 100 which will indicate the percentage of the resulting indicator value. The two curve lines are% K blue, and% D is red.
% D is the moving average value of% K, so it will show a fairly slow movement (lagging). Then traders will pay attention to the 2 moving curve lines to be identified trend behavior. Oscillator will give a signal when the momentum of price movement in a weak state and is one sign that there will be a correction or change of trend.
Momentum that can cause short term trend swings can occur when 2 curve lines cut. The signal can be obtained when the% K (blue) line cuts the% D line (red). You can also increase the probability signal by:
Looking at the curve of the curve at an extreme level
No need to respond to any signals that appear, but you can pick up the probability signal is considered quite strong. Examples are like the oscillator indicator is limited to level 0 to 100. Usually an overbought situation can occur if the% K curve exceeds the 80 level and the oversold condition occurs if the% K curve is below level 20.
Adjust entry with trend at higher time frame in order to avoid false signal.
When the price is in the position of trending strong enough, then the time frame that has a lower stochastic oscillator indicator will show overbought condition, and that is false signal. If you do entry sell, maybe the situation will be false because the uptrend is in strong condition. So it's good to wait for stochastic oscillator which exist at lower time frame and show oversold condition as one of buy signal. Can be mentioned in this condition oscillator indicator shows the right thing to do entry.
Good to learn thanks https://9blz.com/smi-indicator-explained/