USD/CAD REVERSAL PATTERN ON DAILY SUPPORT
GOOD AFTERNOON STEEMIT!
Just a quick Wednesday update with some more forex trading levels, this time on our old friend USD/CAD.
If you're able to combine top quality levels with the price action represented in candlestick patterns, then you're able to set yourself up for success. Just take a look at this bullish pin bar that has formed right on top of the key support zone that you can't miss:
USD/CAD Daily
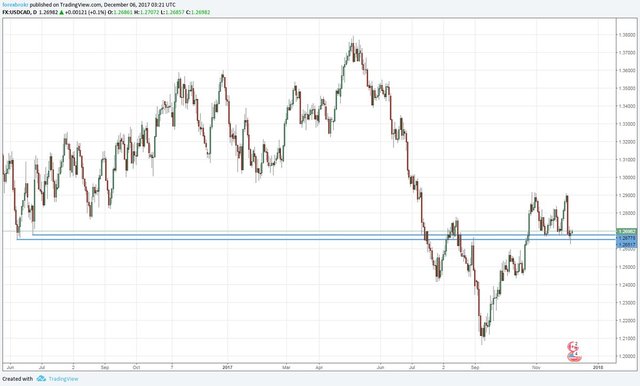
We're above higher time frame support, so it's all about longs for me.
With price now starting to bounce out of the zone, the next step in my trading process is to always zoom into an intraday chart for entries. I've hit the 15 minute chart for this one:
USD/CAD 15 Minute
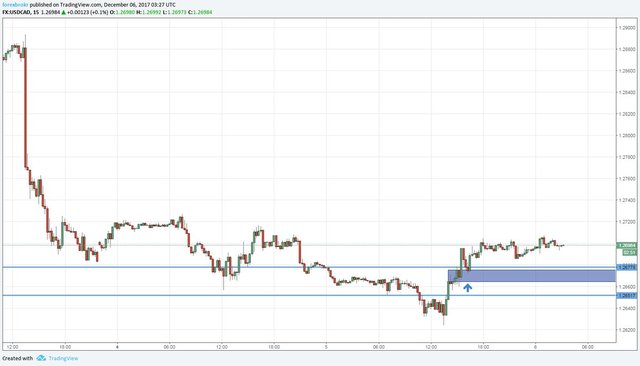
You can obviously see the nice stepping pattern that has formed.
Each step see previous short term resistance retested as support and while still above the higher time frame zone marked in the daily chart above, it's all about finding buy entries.
Hit that buy button.
Peace.
Instagram: @forexbrokr
Website: www.forexbrokr.com

Noice spot!
Am looking at a bearish setup, as we failed with a double top without even reaching a larger res area, but the reversal candle and fakeout printed at a key support might see us easily testing the TL again