USD/CAD at Resistance - Breakout or Fade?
USD/CAD Key Points
- Higher time frame resistance zone.
- Six touches before a stop hunt through the level.
- Looking for reactivation of resistance to get short.
USD/CAD Technical Analysis
Just a simple, horizontal resistance zone in today's USD/CAD chart of the day, below:
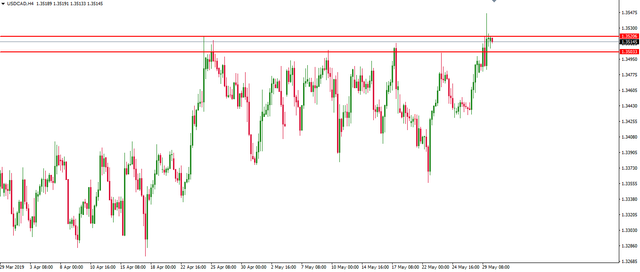
As you can see on the 4 hourly chart, price has pushed into this zone, now six times.
Yes, that's right, SIX!
Now there are two schools of thought on a zone that has had this many touches:
- You can see it as weakening the strength of the resistance zone with each touch.
or...
- You can see it as a positive because resistance continues to hold.
In this case, as there was no significant lower low, I would probably lean toward line of thought number one.
Something that was confirmed when price yesterday, ripped throught resistance.
That rip was however short lived and is just another example of how markets don't ever do what the textbooks say they're supposed to do.
Wherever you find a clean, horizontal support/resistance level like this (and SIX touches is pretty strong), you're going to get a build up of retail or weak money stop buy orders above it.
Buy orders that look juicy as fuck to smart money, looking to build a larger sell position.
So price poked it's head through resistance, cleaned out the stops and now tucking back under the resistance zone, I'm looking for some sort of reactivation before getting short.
Keep an eye on those intraday charts.
This one's coming.
Best of probabilities to you.
Dane.
Upcoming Economic Releases
- CAD Current Account
- USD Prelim GDP q/q
- CAD Gov Council Member Wilkins Speaks
- CAD GDP m/m