US Dollar at Resistance so Looking to Short USD/JPY

Hey guys,
Friday night forex charts are always interesting as the end of week, plus in this case the end of month flows, more often than not sees price position itself at interesting levels.
Today’s focus shifts to the US Dollar, starting with the US Dollar Index daily chart below:
USDX Daily
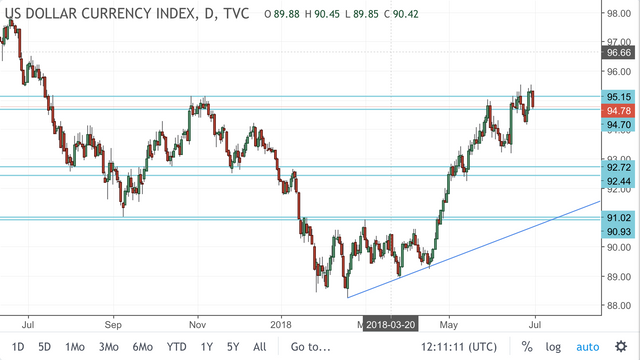
As you can see, price looks to be holding the major resistance zone that we now have in play.
I’m not going to include an intraday chart, but even as I’m typing this, I can see the daily candle on my TradingView chart flailing wildly about. End of week/month flows indeed. It doesn’t know what it wants.
But as always, if you mark your higher time frame zones properly, you can always use them to manage your risk around when they hold or break. In this case, that would be resistance holding.
Take a look at the Yen daily for one particular setup:
USD/JPY Daily
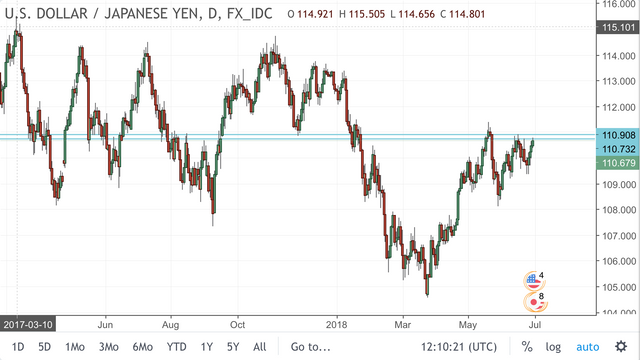
With USDX at resistance, USD/JPY also finds itself stuck at quite a nice looking resistance zone on the higher time frame chart.
If this holds next week, then zoom into an intraday chart and look for an entry:
USD/JPY Hourly
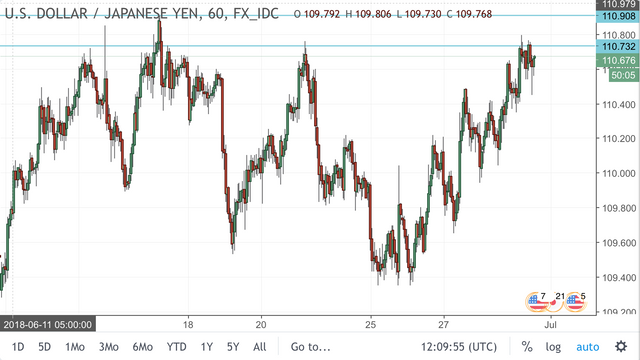
That would be any short term pullbacks into previous support turned resistance on the hourly.
Safe trading.
✌🏻.
@forexbrokr | Steemit Blog
Market Analyst and Forex Broker.

Twitter: @forexbrokr
Instagram: @forexbrokr
Yes need this pair for market
USDJPY short yes.
u r right sir
I agree.
I like your analysis. I also think that if you swing trade, we are setting up for a good short on UJ. Your highest TF here is D, if you go on W, we are approaching a strong trend line, which supports the likelihood of shorts.
I sold already.