Oil and Cable Trading Day

Hey guys,
I’ve spent the morning with this cutie:

So forgive me for being a little slow in getting today’s blog out on Steemit.
I’ve been following the charts all day from my phone though and I’m looking forward to piecing it all together here.
Let’s get into it!
Market Overview
Oil markets are ripping today. Yep, better get that petrol flowing into your car, because those scumbags at the pumps are going to be jacking up those prices before you know it.
In terms of commodities markets, a combination of oil inventory draws, geopolitical issues that we’ve been talking about at nauseum and our old friends, the Saudis, talking about manipulating prices toward $100 USD, have all conspired to give oil the tip you’re going to see on the charts below.
Taking a look at forex markets now, we have the Great British Pound coming under some serious selling pressure, before ripping straight back up into resistance that we’ve been watching for a trade. GBP dropped on the back of lower than expected inflation prints, but in today’s news cycle driven markets, that of course didn’t last long.
There is a however plethora of news to move markets tonight, so let’s get some levels up and see how price reacts when trading around them.
Commodities Markets
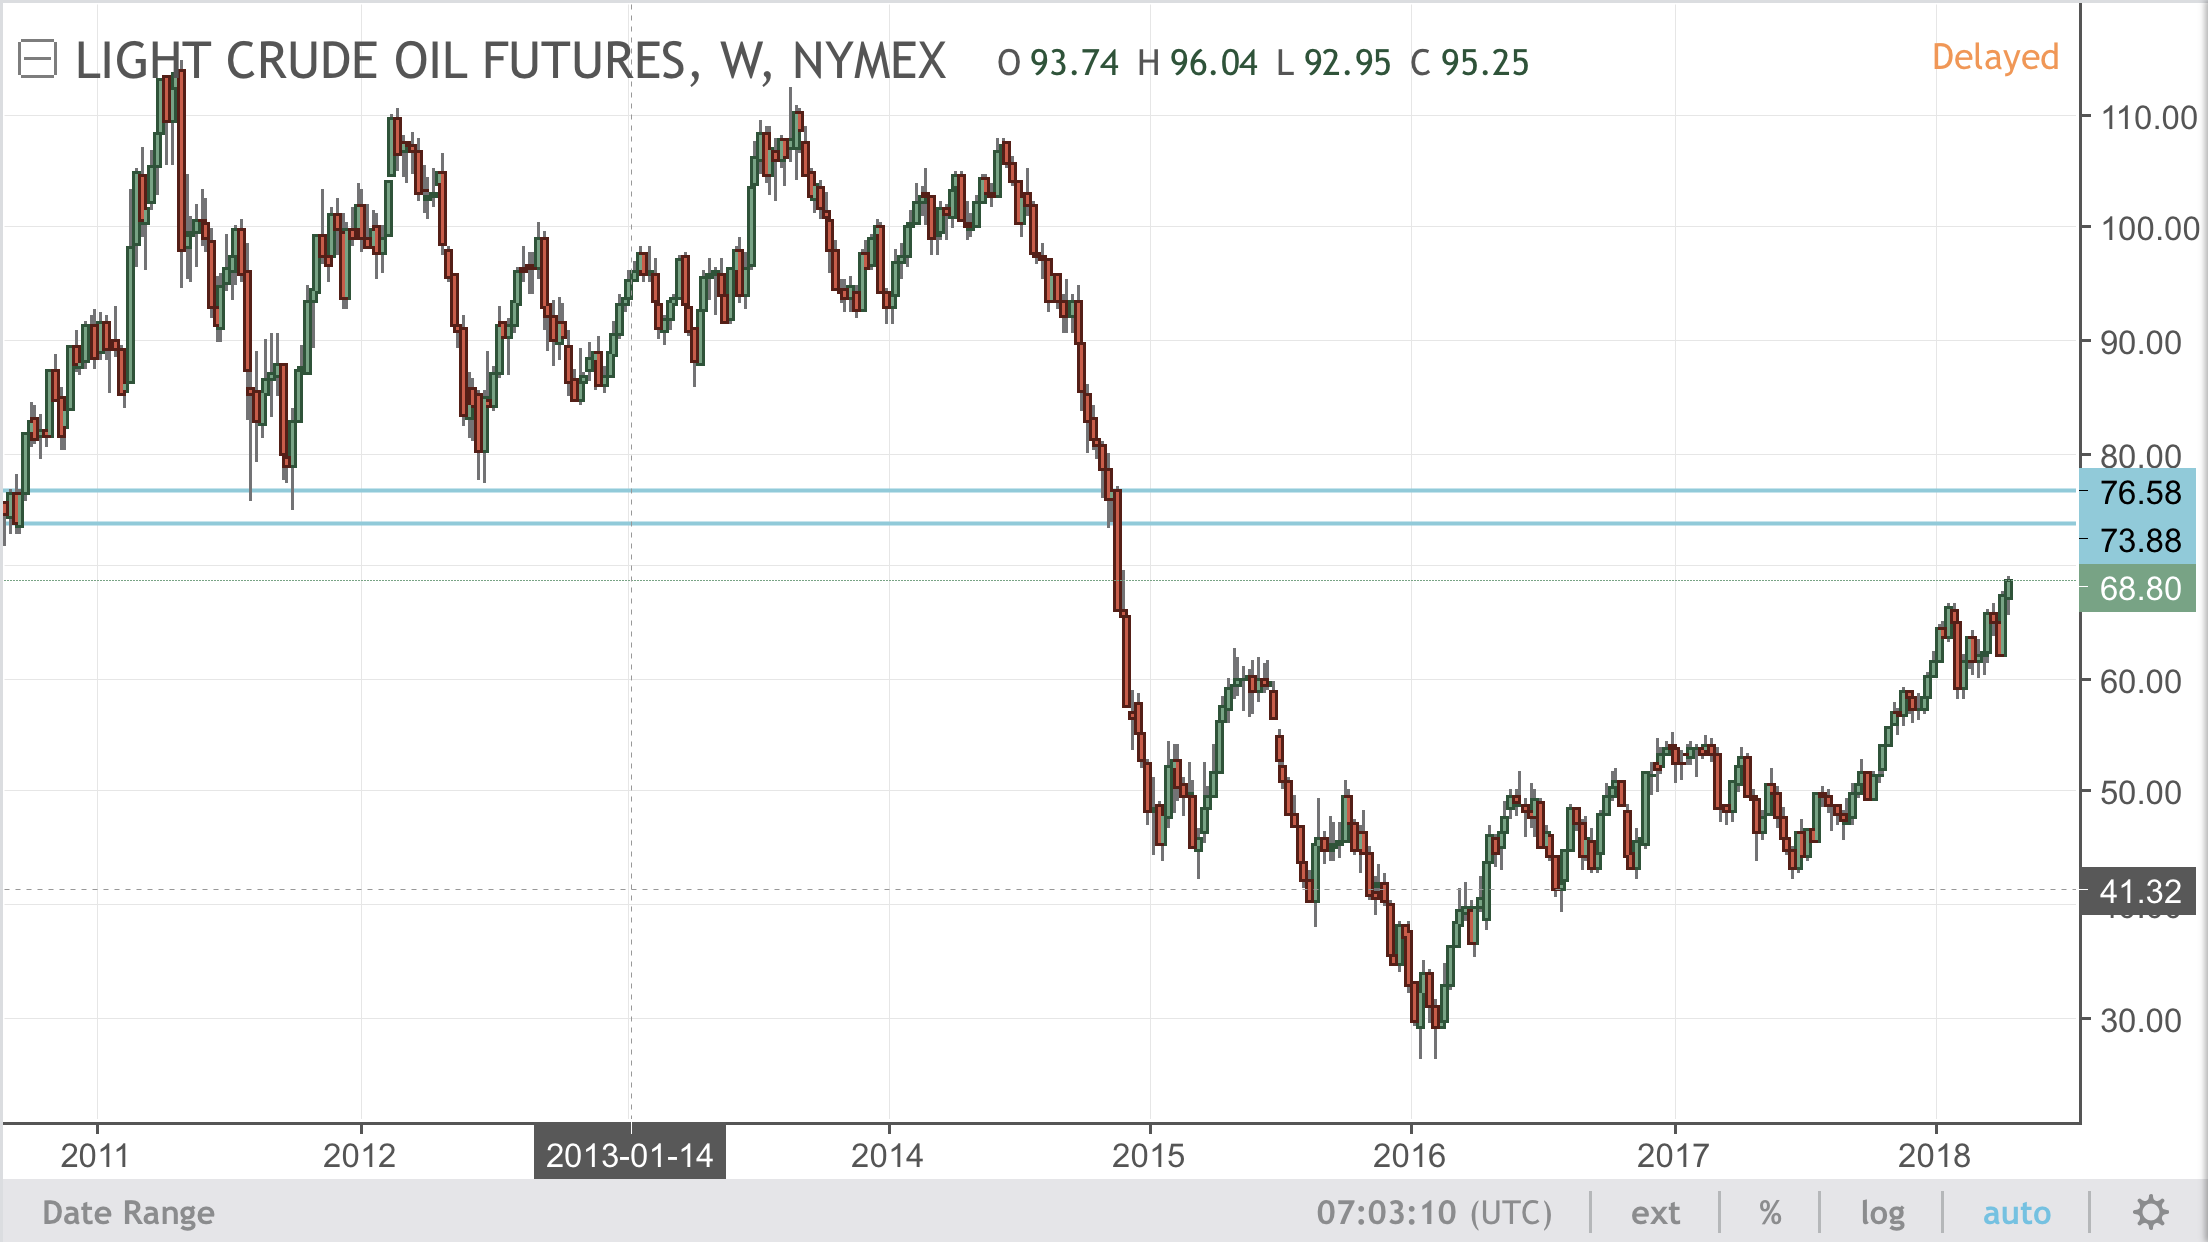
Getting straight into Oil, we start with the higher time frame chart and the key zone you can see on the weekly chart below:
OIL Weekly

No price isn’t there yet, but with mometum pushing price up, level will at the same time be pulling price toward it.
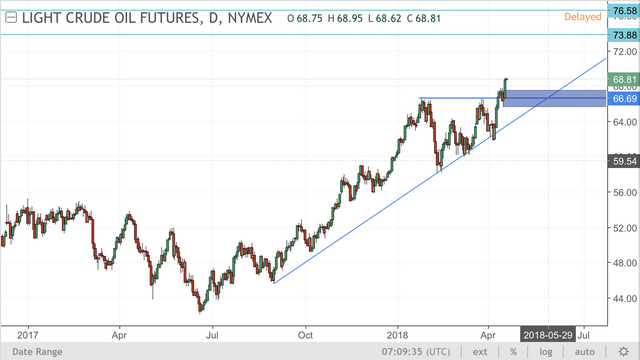
Now drill down into the daily chart and take a look at what we’ve got here:
OIL Daily

A nice ascending triangle breakout!
I’m waiting for a retest of the marked blue level and if the buyers show up, then it’ll be a nice long with a target of the weekly resistance zone.
Maybe paying a bit more to fill up my car won’t be such a bad result after all.
Forex Markets
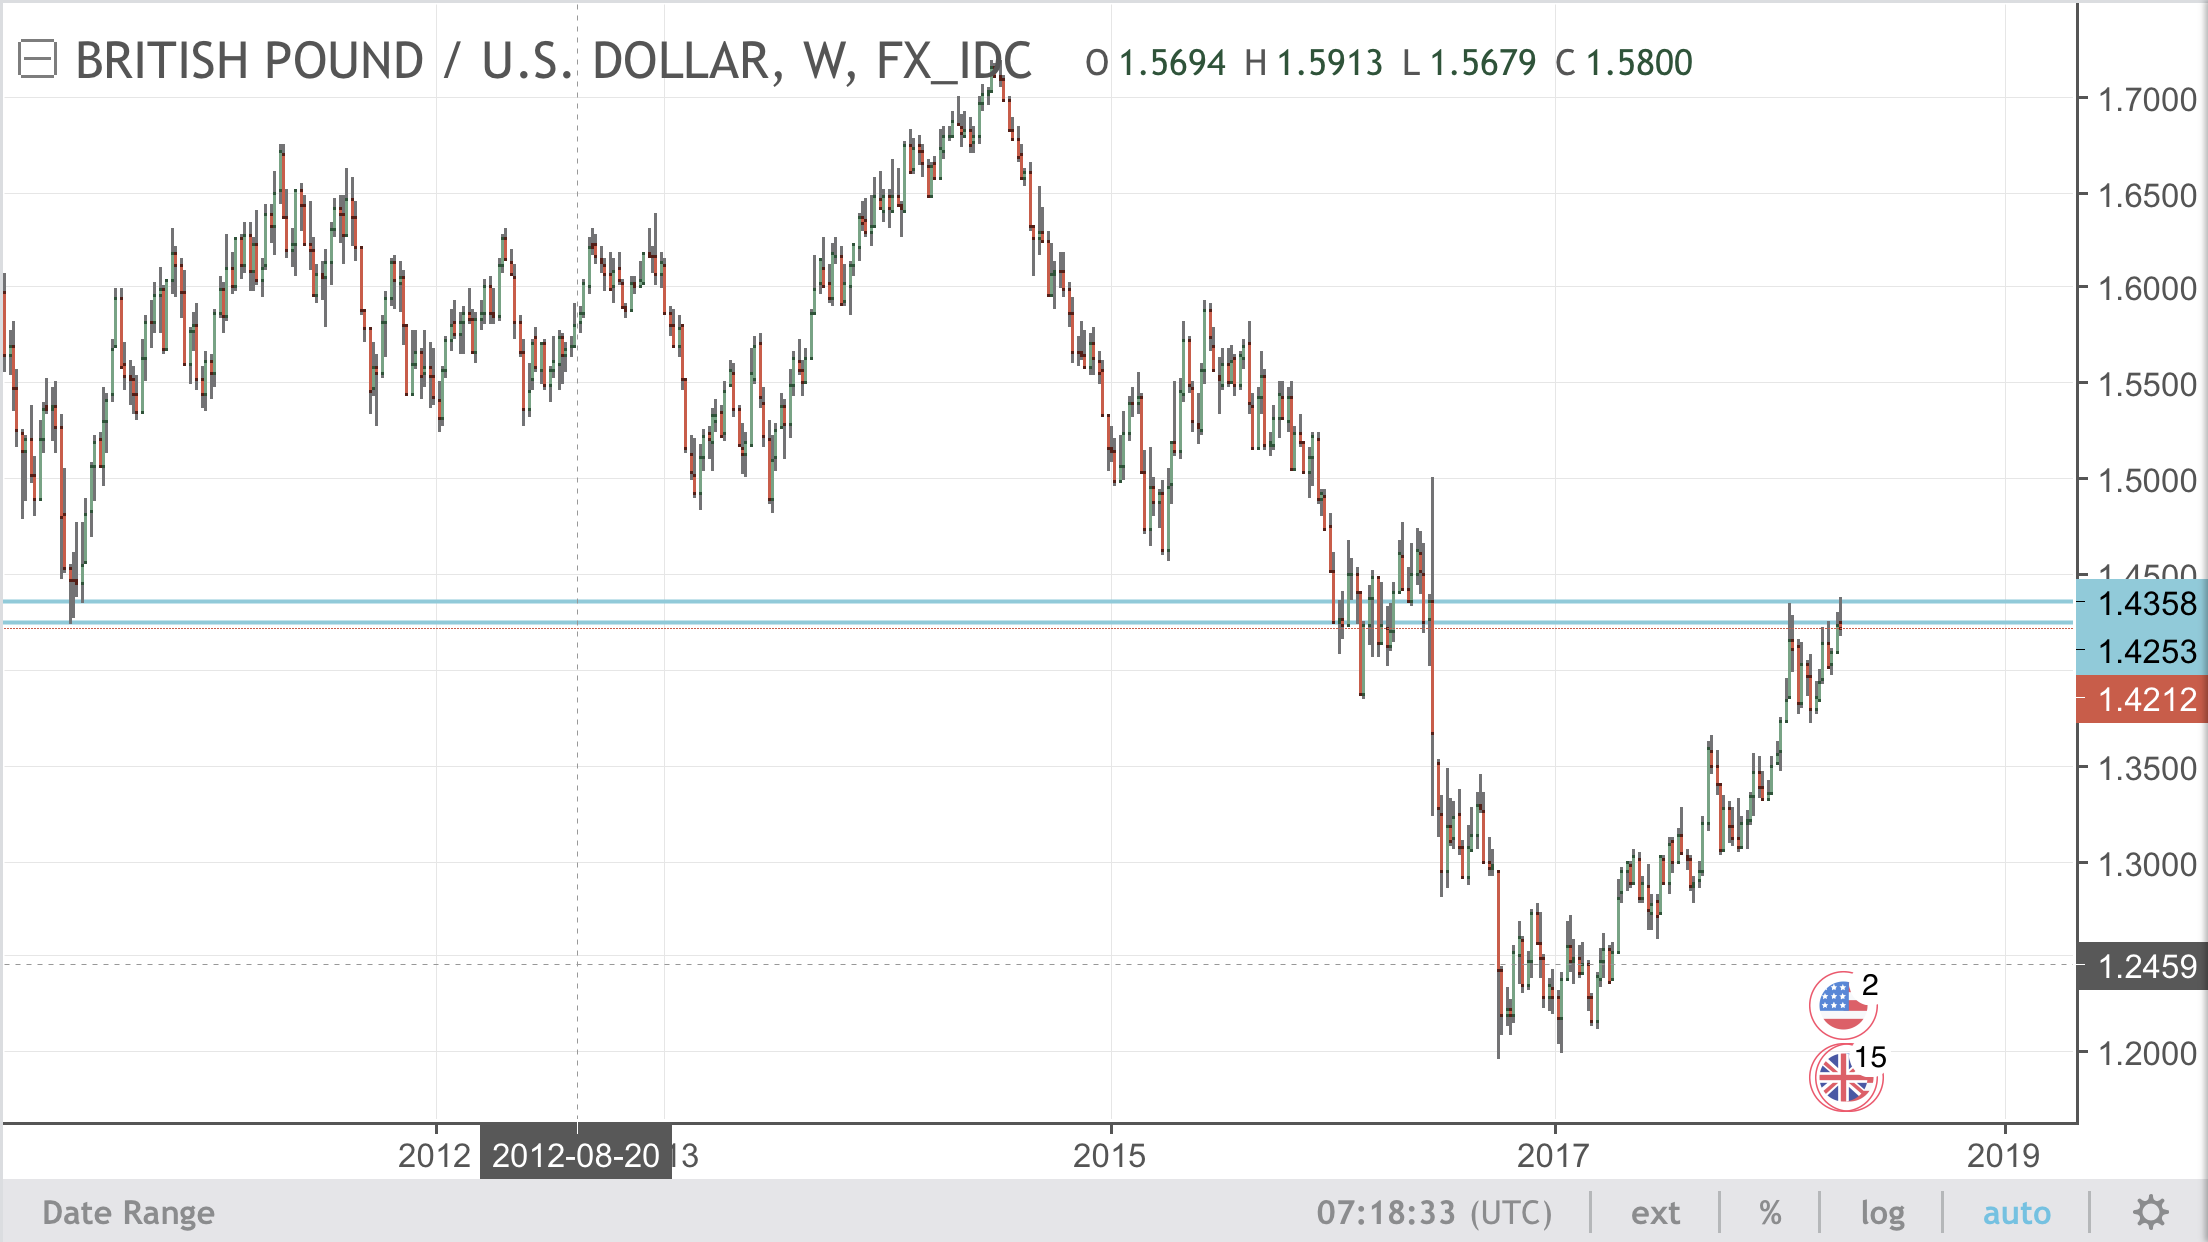
Now moving along to forex markets and a look at Cable, we once again start with the higher time frame weekly chart for a key level:
GBP/USD Weekly

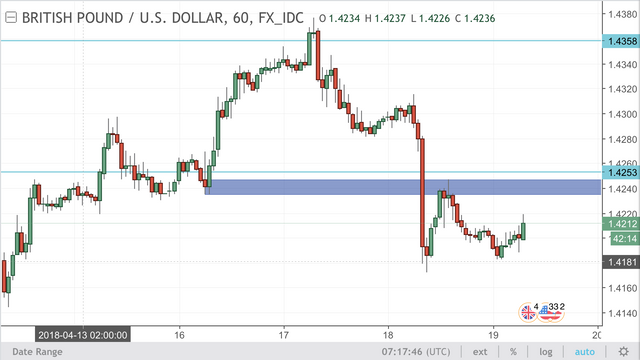
Now we’ve spoken about this resistance zone in the weekly market preview and as you can see on the following hourly chart, price has rejected out of it nicely:
GBP/USD Hourly

This of course means we look for short term retests to short so we’re on the right side of the higher time frame chart and maximising our risk reward with smarter entries.
Price has hit level before, but it looks like it’s going to again if you haven’t yet got an entry.
Enjoy ✌🏻.
@forexbrokr | Steemit Blog
Market Analyst and Forex Broker.

Twitter: @forexbrokr
Instagram: @forexbrokr