AUD/USD Back Above Daily Support/Resistance... Or is it?

Direct from the desk of Dane Williams,
This is not your average forex broker blog.
AUD/USD Technical Analysis
Afternoon team,
While AUD/USD has been below higher time frame resistance, we've been trading the pair from the short side.
But following Friday's Non-Farm Payrolls release, the Aussie has now jumped back above our higher time frame line in the sand.
If you're already a reader of this blog, then you'll no doubt have the following line drawn on your daily chart, but if you need a refresher, then here it is.
AUD/USD Daily:
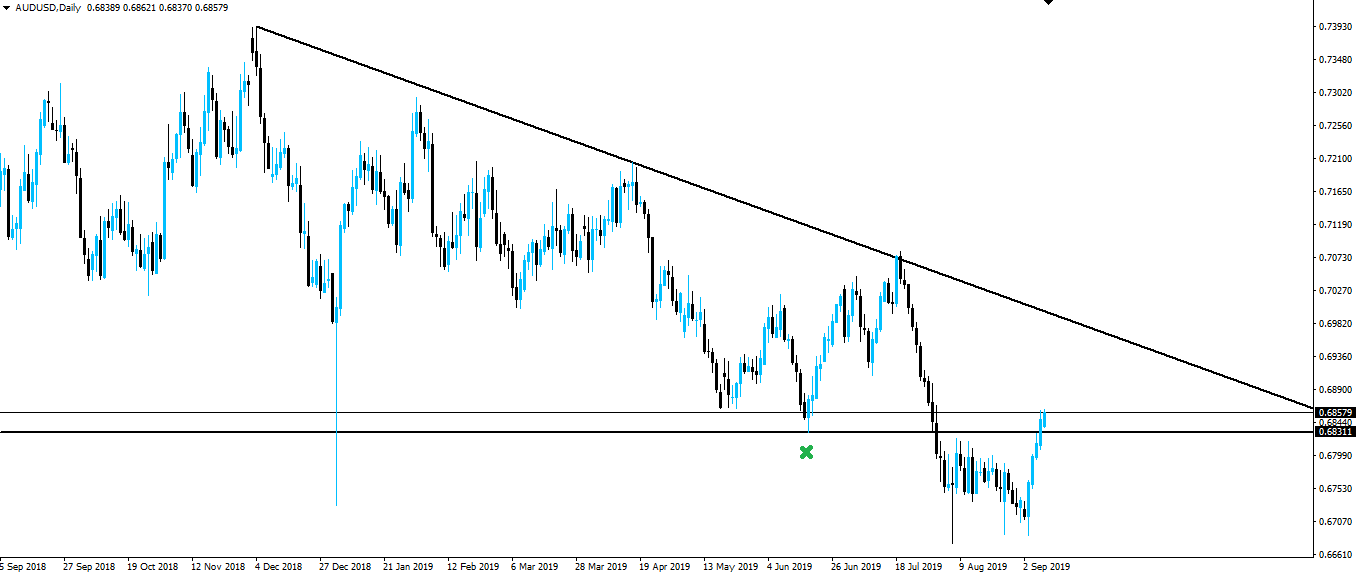
As you can see, the line we've had on our charts, is drawn from the June 2019 low.
But because the level is on a higher time frame chart, no matter where we choose to draw this line, we should never expect the line to be a brick wall that will stop momentum exactly to the pip.
With that in mind, now take a look at the same AUD/USD daily chart, with another line added in from the May 2019 swing lows.
AUD/USD Daily 2:

That changes things entirely, doesn't it!
No longer are we looking at price being above higher time frame support/resistance, but now we're right in the midst of a resistance zone.
Something I always try to teach new traders, is that support/resistance, especially on a higher time frame chart, should be viewed more as a zone than a hard level.
Support/resistance is a subjective thing. It only matters because other traders are watching it, but other traders might be watching something slightly different to you.
Its an art, not a science.
Stay safe out there!
Want to read how I plan to attack these higher time frame, market narratives and actually zoom in to trade them?
Then click here to join my Inner Circle.
Best of probabilities to you,
Dane.
Today's Economic Releases
Monday:
GBP GDP m/m
GBP Manufacturing Production m/m
@forexbrokr | Steemit Blog
Market Analyst and Forex Broker.