GBP/JPY Rebounds, But Stays In A Downtrend
GBP/JPY traded higher today, after hitting support at 124.00 yesterday. Overall, the price structure remains of lower highs and lower lows below the downtrend line drawn from the high of February 26th, and thus, even if the recovery continues for a while more, as long as the rate stays below that line, we would consider the near-term outlook to be negative.
As we already noted, the rebound may continue for a while more and perhaps challenge the 128.80 zone, marked by the inside swing lows of Monday and Tuesday. The bears could take charge from near that area and perhaps dive for another test at the 124.00 hurdle. If they don’t stop there this time around, we could see them aiming for the “flash crash” low of October 7th, 2016, the break of which may extend the slide towards the low of July 26th, 2012, at around 120.80.
Looking at our short-term oscillators, we see that the RSI has rebounded and just exited its below-30 zone, while the MACD, although below both its zero and trigger lines, shows signs of bottoming as well. These indicators suggest that the downside momentum is slowing, which corroborates our view for some further recovery before the bears take the reins again.
In order to start examining the case of a trend reversal, we would like to see a clear break above 131.30, a resistance marked by Tuesday’s high. Such a break may also drive the rate above the downtrend line and could initially aim for the 134.20 obstacle, defined as a resistance by the high of March 13th. Another break, above 134.20, could pave the way towards the pea of March 10th, at around 137.20.
GBP/JPY 4-hour chart technical analysis 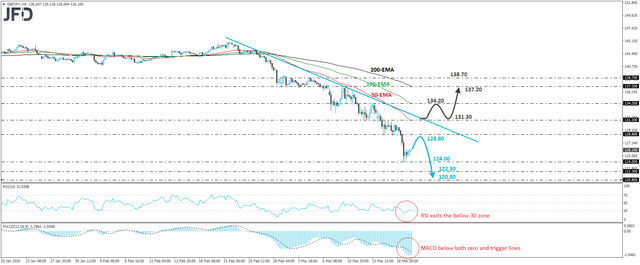 GBP/JPY 4-hour chart technical analysis