Trendline
What are Trendlines
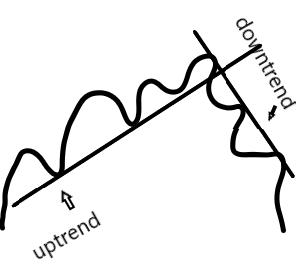
A trendline is a straight line that connects 2 or more points of support / resistance in a trend and acts a line of support or resistance for that trend.
An uptrend is when the market makes higher highs and higher lows.
A downtrend is when the market makes lower highs and lower lows.
Drawing Trendlines
There are 3 main categories of trend lines.
The short term trend line also known as the inner trend line.
The medium term trend line also known as the outer trend line.
The long term trend line.
Drawing Trend lines
ABC Price Swings
The market moves in ABCD Price Swings.
ABC’s repeat themselves as long as the trend continues.
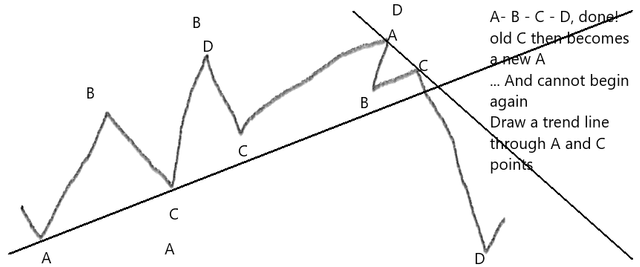
Trend line must be drawn accross the lows / highs of support / resistance connecting A’s and C’s after a new high / low has been made.
Connects A’s with other A’s and C’s just as long as you are not drawing through the candles.
Look for the most recent ABCD and draw a trend line connecting the latest A to the latest C that will be the short term trend line.
Look for the lowest A and draw your trend line using the rules you;ve learned this will be your medium term trend line.
Compress the chart or go to a larger timeframe to draw the long term trend line.
Trend Line Breaks
Whether short term trend line is broken the market will predominantly move to the medium term / outer trednline.
When the medium term trednline is broken the market may aim to test the longer term trend line.
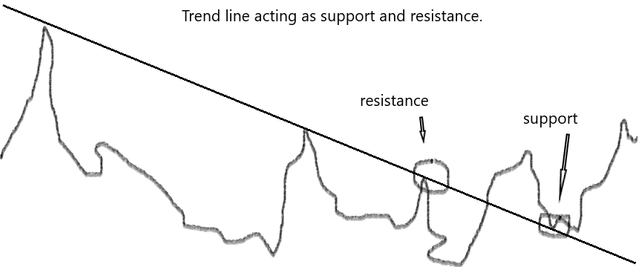
Trendlines acts as support and resistance so when a uptrend line is broken it will now act as resistance and when a downtrend line is broken it will now act as support.
Taken from my website forexblogz.kbasante.com