Walking Through Data: Hog and Pig Farms
In examining data, we can see telling relationships about agriculture. Here these relationships – and ways of visualizing them – are discussed.
Data by farm size
Yesterday I wrote a post about pork agriculture in the United States. In this post, I made a graph from the following data, which is from the 2012 US Census of Agriculture:
| Hogs/Pigs on Farm | Farms | Hogs/Pigs |
|---|---|---|
| 1 - 24 | 41,688 | 244,250 |
| 25 - 49 | 3,435 | 116,808 |
| 50 - 99 | 2,161 | 146,967 |
| 100 - 199 | 1,469 | 201,460 |
| 200 - 499 | 2,115 | 683,977 |
| 500 - 999 | 1,977 | 1,384,921 |
| 1000 - 1999 | 2,677 | 3,662,168 |
| 2000 - 4999 | 4,718 | 14,867,199 |
| 5000+ | 3006 | 44,719,035 |
This data can be used to make a bar chart showing how many hogs and pigs are on large farms. Below is the graph I used in yesterday's post.
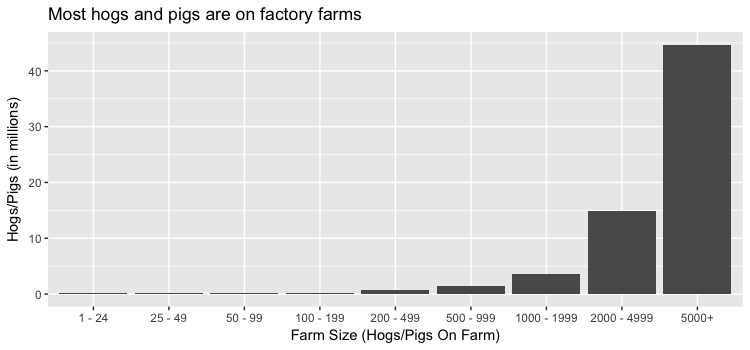
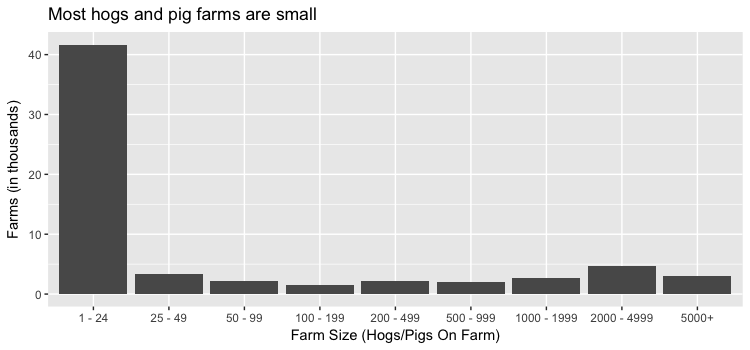
This graph is informative, but doesn't reflect all the interesting things in the above data. For instance, seeing this graph alone might lead you to an assumption that most farms are factory farms, but that's not true. Let's take a look at a graph of the number of farms by farm size.
Trends can help explain perceptual disparity between facts and anecdotes.
This trend is pretty surprising, but also may explain discrepancies that I have personally encountered. While we know that 96% of hogs and pigs are on factory farms, it can be hard to convince people that this is true. On several occasions when I have discussed pork agriculture with people, it is brought up that they know a friend or a family member who has worked on a farm where things aren't nearly as bad as "the other farms."
Knowing that most farms are small while most hogs and pigs are on factory farms provides some explanation for this: while you are more likely to have seen or heard about a small farm, the pork on your plate is extremely likely to have come from a factory farm. Notably, the disparity between farms people have encountered and the prevalence of factory farms is exacerbated when you consider that people who have the luxury of leisurely discussing livestock populations are less likely to be around factory farms, since hog factory farms are about nine times more likely to exist in areas affected by poverty.
Combining graphs
It would be great to show all of this information in one simple graph, but to do so there should be a common metric that works to both numbers. While the number of total farms is in the ten thousands and the number of total pigs and hogs is in the ten millions, we can examine both of these quantities by farm size as a percentage of the total. Using the above data, we can make this conversion.
| Hogs/Pigs on Farm | Percentage of total farms | Percentage of total Hogs/Pigs |
|---|---|---|
| 1 - 24 | 65.914050 | 0.3699256 |
| 25 - 49 | 5.431174 | 0.1769100 |
| 50 - 99 | 3.416817 | 0.2225869 |
| 100 - 199 | 2.322677 | 0.3051186 |
| 200 - 499 | 3.344085 | 1.0359084 |
| 500 - 999 | 3.125889 | 2.0975139 |
| 1000 - 1999 | 4.232679 | 5.5464884 |
| 2000 - 4999 | 7.459760 | 22.5169210 |
| 5000+ | 4.752870 | 67.7286271 |
In order to graph this data, a bar plot with two variables does the trick.
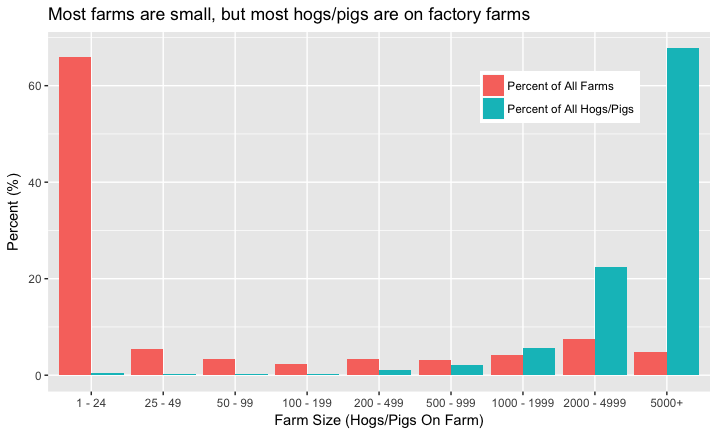
This graph illustrates disparity farms and livestock that helps to explain the anecdotes I personally have encountered. The drawback of this representation is that specific numbers are not available, and a viewer would not be able to tell that there are about 42 thousand farms with 1 - 24 pigs and hogs, or that 45 million pigs and hogs are on farms with over 5000 of the same species.
I hope this walkthrough has been informative and interesting! All code used to generate these charts is on github.
Hi! Great post. Im a small farmer in Canada (sheep, not pigs ), and youre absolutely right about how many people know a farmer (and see things are done humanely on that farm), but likely still eat factory farmed meat. The very best solution that consumers can effect to take the power away from factory farming and their disregard for animal welfare is to shop direct from the farm! You might pay a bit more because those small farmers need to have an income, and their profit margins work way differently than a huge factory farm, but by doing so, you have helped a family put their kids in music lessons. You've sourced your meat from an animal who spent its life in the sunshine, with a great deal more freedom to move, play, and enjoy life, that was likely not medicated on a whim, and who only ever had one REALLY bad day, and it was over quick.
The next best solution is to start farming yourself, if at all possible. This might be as simple as a pot of tomatoes grown on your apartment balcony, as unorthodox as tilling up your backyard and planting a huge garden with a few chickens to scratch between the rows, providibg fertilizer(manure), pest control, and eggs and meat from a completely verifiable source(city bylaws permitting you keeping chickens of course), or as crazy as buying a ramshackle plot of land in the country and raising crops and/or livestock to sell to all your friends who still live in the city!
Thank you so much for this fantastic comment, @tanglebranch! I am thrilled to hear from a small farmer who can speak to data, and advocate so well for buying directly from farms. These are great suggestions, and I look forward to your posts on this site!
Really nice (valuable) walk through of the ways in which data can (should) be represented. You are definitely living up to your name @somethingburger! (And I think we know what's in that burger, eh?)
Thanks @kenfinkel!
Congratulations @somethingburger! You have completed some achievement on Steemit and have been rewarded with new badge(s) :
Click on any badge to view your own Board of Honor on SteemitBoard.
For more information about SteemitBoard, click here
If you no longer want to receive notifications, reply to this comment with the word
STOP