Cryptocurrency Quantitative Trading for Beginners - Taking You Closer to Cryptocurrency Quantitative (4-2)
function createNet(begin, diff) {   // begin, diff are parameters, begin is the initial price, diff is the grid spacing (the spacing of the equal difference grid is the price)
    var oneSideNums = 10            // The grid generates 10 bars on the upward and downward sides. The above chart is a side of the generation of 2 bars (AB side, CD side) and the generation of 10 bars, you can imagine them by yourself.
    var up = []                     // Used to store the upward "grid line" data structure
    var down = []                   // Used to store the downward "grid line" data structure
    for (var i = 0 ; i < oneSideNums ; i++) {    // Determine the number of times according to the size of oneSideNums, and construct the "grid line" data structure cyclically
        var upObj = {                            // Construct an upward "gridline" data structure
            buy : false,                         // Buy marker, initial marker is false, meaning no buy
            sell : false,                        // Sell marker ...
            price : begin + diff / 2 + i * diff, // The price level represented by this "grid line" can be observed according to the cycle, and the price level is rising in turn.
        }
        up.push(upObj)                           // The constructed "gridline" data structure is placed into the up array

        var j = (oneSideNums - 1) - i            // The change in j during the loop is: 9 ~ 0
        var downObj = {
            buy : false,
            sell : false,
            price : begin - diff / 2 - j * diff,
        }
        if (downObj.price <= 0) {                // The price cannot be less than or equal to 0
            continue
        }
        down.push(downObj)                       // The constructed "gridline" data structure is placed in down array
    }

    return down.concat(up)                       // Add up after down to form a grid array structure with grid line prices from small to large
}
You can run this function separately to see the effect. [Debugging Tools] or [Backtesting System] on FMZ are very convenient to debug such small codes.
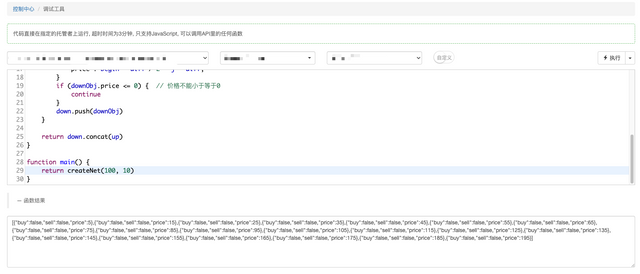
The constructed data can be observed.
[
    {"buy":false,"sell":false,"price":5},
    {"buy":false,"sell":false,"price":15},
    {"buy":false,"sell":false,"price":25},
    {"buy":false,"sell":false,"price":35},
    {"buy":false,"sell":false,"price":45},
    {"buy":false,"sell":false,"price":55},
    {"buy":false,"sell":false,"price":65},
    {"buy":false,"sell":false,"price":75},
    {"buy":false,"sell":false,"price":85},
    {"buy":false,"sell":false,"price":95},
    {"buy":false,"sell":false,"price":105},  // 100 is the starting price, starting from 105 and going up the first line, with an interval of 10
    {"buy":false,"sell":false,"price":115},  // ...
    {"buy":false,"sell":false,"price":125},
    {"buy":false,"sell":false,"price":135},
    {"buy":false,"sell":false,"price":145},
    {"buy":false,"sell":false,"price":155},
    {"buy":false,"sell":false,"price":165},
    {"buy":false,"sell":false,"price":175},
    {"buy":false,"sell":false,"price":185},
    {"buy":false,"sell":false,"price":195}
]
- Trading logic analysis
After analyzing the data structure of the grid, we need to consider the specific trading logic of the grid strategy. In fact, the logic of buying and selling is very simple. We have already drawn it in the above chart, buying means crossing a certain line below, and selling means crossing a certain line above. So how do you show the crossing above and below? It is also very simple, we can judge only by comparing the price positions of two moments.
Still using the previous chart.
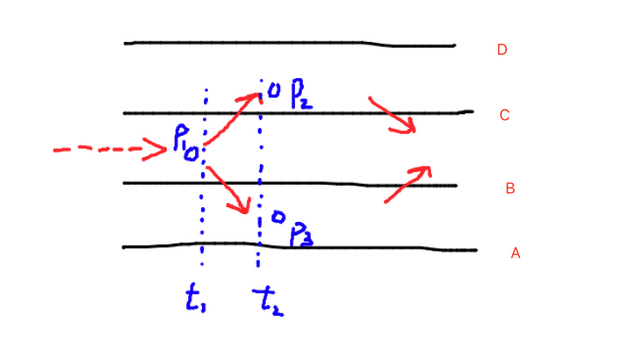
t1 is a moment, t2 is a moment after t1, to judge the crossed above line C, we only need to judge P1 < C and P2 > C.
Similarly, to judge the crossed below line B, we only need to determine P1 > B and P3 < B.
At that time, we only need to traverse (traversing is commonly referred to as look at it one by one) each line in the grid array, and judge whether to cross it above or below. Is it simple?
Having caught the price crossing above and below, is it possible to place an order when these actions are triggered?
Obviously, it is not possible. If the price cross above and below repeatedly on one line, wouldn't it waste the fee for repeated tranding at the same price level? Therefore, there are still a series of judgment conditions for triggering the price crossing above and below, which requires the use of the buy/sell markers in the grid line data structure we just constructed (for example: {"buy":false,"sell ":false,"price":5}).
Thanks for reading, we will continue to explain and learn in the next issue.