Cryptocurrency Quantitative Trading for Beginners - Taking You Closer to Cryptocurrency Quantitative (4-1)
In the previous articles, we have learned the basic concepts of so many cryptocurrency, programming, and quantitative trading. Finally, we can move to the topic and talk about the strategy itself. In this article, we will learn to implement a simple strategy together.
For "Grid Strategy", someone who have made quantitative trading should have heard of it, but it doesn't matter if you haven't. Nowadays all exchanges have launched their own programmatic and quantitative trading functions, and the most and easiest-to-use strategy is grid strategy. However, the grid strategy functions and details provided by each exchange are different, since we plan to move to the cryptocurrency quantitative trading, why don't we implement a grid strategy by ourselves?
At this time, someone may have said:
“I can't write code!”
“I would get a headache when I saw the code!”
That's true. It is indeed quite difficult for someone who are not major in computer software or have not been engaged in programming work to develop a complete trading strategy by themselves. Because you have to do a series of pre-work from the beginning of docking the exchange interface (maybe your trading logic program is only 100 lines, but other coding work to be done is quite a lot, and it is more difficult than writing trading logic.)
At this time, if you have a handy tool, it is quite simple, at least the difficulty is reduced by 70%. You can imagine how convenient and fast it is if you only write the trading logic itself, and all other exchange interface connection, signature verification, configuration files, operating environment construction, UI interface writing, interactive writing and so on are all ready-made.
Don't believe it?
Let's try it out!
Implement a simple spot grid strategy
The tool we use is: FMZ Quant Trading Platform (FMZ.COM). The core of grid strategy design actually is the logic of grid buying and selling, so this is something that must be clarified before designing a strategy. Our goal is to make the strategy design simple and easy to understand, so the fewer parameters and the simpler the logic, the better.
The following is the basic flow of designing a strategy:
- Summary of strategic needs
To put it simply, it is what, how, and what functions your strategy is going to do. This information can be written in a document (notepad or something) before you write the strategy code. It is very simple to develop strategies on FMZ, The platform has prepared solutions for these requirements for you, and I don't need to write these requirements into a notepad (that is not very convenient to manage). I write the strategy requirements in the strategy notes directly.
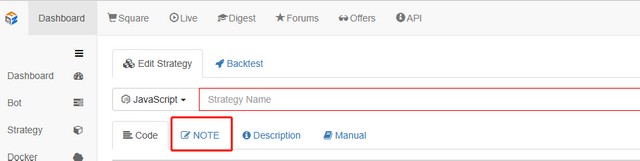
Just remember to save the strategy after finishing, and then we will write the strategy requirements (the strategy requirements are not static, and it is also possible to record while developing).
The strategy is designed as a spot trading strategy with the trading pair XXX_USDT, such as BTC_USDT.
The grid is designed to be equally spaced, which simply means that the distance between two adjacent points on the grid is a fixed spread.
The grid is designed as an infinite grid that can be expanded infinitely.
Use market orders for order placement.
- Construct the grid data structure:
For unclear ideas, we can draw and analyze at the beginning.
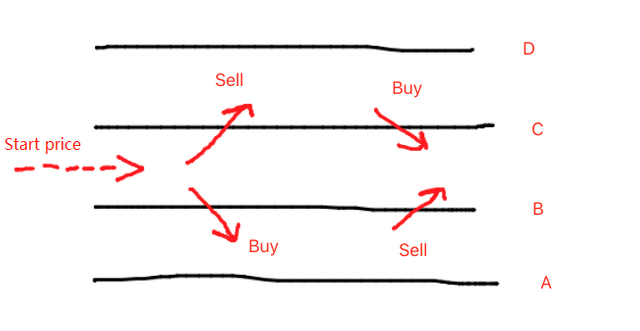
A grid can be constructed in both up and down directions from the starting price as a base point. The grid is a layer-by-layer buy line and sell line. Looking at the graph, we can see that each line has two possibilities:
The price crossed above the SMA.
The price crossed below the SMA.
When the price crosses above the SMA, it means that the price is going up and needs to be sold, and then wait for the price to fall and buy to make a profit.
When the price crosses below the SMA, it means that the price is going down, you need to buy it, and then wait for the price to rise and sell it to make a profit.
So each grid line has two ways for trading: buy and sell. And each grid line has an inherent property, which is the price marked by this line. An example is the representation of A/B/C/D on the chart.
When designing a strategy, figure out what we want to do first, and then it's easy to do it.
Write a function that constructs the grid data structure:
To be continued...