from selenium import webdriver
from selenium.webdriver.common.keys import Keys
from selenium.common.exceptions import NoSuchElementException
import time
import re
import numpy as np
from bs4 import BeautifulSoup
browser = webdriver.Firefox()
browser.get("https://explorer.flashcoin.io/topaddress") # Load page
#browser.get("https://explorer.flashcoin.io/address/URvNQgWQ1N1P3Q3yMAte5JxcdSVzw3YdFy")
time.sleep(20)
html=browser.page_source#获取网页的html数据
soup=BeautifulSoup(html,'lxml')#对html进行解析,如果提示lxml未安装,直接pip install lxml即可
soup = BeautifulSoup(str(soup.find_all('tbody').pop()), "lxml")
# print(soup.prettify())
table = soup.find_all('tr')
top100= {}
for row in table:
if row.find('a'):
rowcell = row.find_all('td')
address = rowcell[1].find('a').renderContents()
coins = float(''.join(rowcell[2].renderContents().split(' ')[0].split(',')))
#print [address,coins]
top100[address]=coins
import numpy as np
import matplotlib.pyplot as plt
from matplotlib import rc
coins_list = []
for one in top100:
coins_list.append(top100[one])
coins_list.sort(reverse = True)
percentages_list = []
for i in range(len(coins_list)):
if i ==0:
percentages_list.append(coins_list[i]*1.0/900000000)
else:
percentages_list.append(percentages_list[i-1]+coins_list[i]*1.0/900000000)
count_list = np.arange(len(coins_list))+1
fig = plt.figure()
ax = fig.add_subplot(111)
lns1 = ax.plot(count_list,np.array(coins_list)*1.0/1000000, 'k-')
for i in [1,20,40,60,80,100]:
plt.plot(i, coins_list[i-1]*1.0/1000000,'kd')
#print i,coins_list[i-1]
plt.text(i, coins_list[i-1]*1.0/1000000+2, '{}M'.format(round(coins_list[i-1]*1.0/1000000,2), fontsize=12))
#print 'The first {} addresses account for {}% Flashcoins'.format(i, round(coins_list[i-1],4)*100)
ax2 = ax.twinx()
lns2 = ax2.plot(count_list, np.array(percentages_list)*100, '-r')
ax2.tick_params(axis='y', colors='red') # 刻度颜色
ax2.spines['right'].set_color('red') # 纵轴颜色
#setp(ax2.get_yticklabels(),color='r') # label颜色
lns = lns1+lns2
labs = [l.get_label() for l in lns]
#ax.legend(lns, labs, loc=0)
ax.grid()
ax.set_xlabel("Top 100 addresses of Flashcoin")
ax.set_ylabel(r"Balances (Millions)")
ax2.set_ylabel(r"Cumulative percentages (/%)",color='red')
for i in [1,10,20,40,60,80,100]:
plt.plot(i, percentages_list[i-1]*100,'rd')
plt.text(i, percentages_list[i-1]*100-5, '{}%'.format(round(percentages_list[i-1],4)*100, fontsize=12),color='red')
#print 'The first {} addresses account for {}% Flashcoins'.format(i, round(percentages_list[i-1],4)*100)
plt.xlim(0,100)
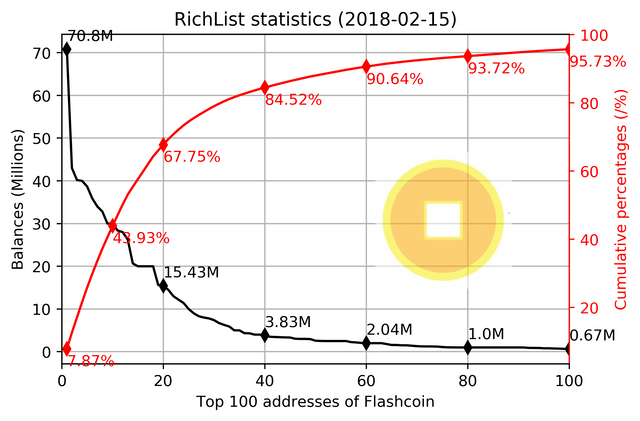
plt.title('RichList statistics ({})'.format(time.strftime("%Y-%m-%d", time.localtime()) ))
import matplotlib.image as image
im = image.imread('flashcoin-icon.png')
im[:, :, -1] *= 0.6 # set the alpha channel
fig.figimage(im, 1375, 485,zorder=20)
plt.savefig('myfig.png',dpi=400,bbox_inches='tight')
ax2.set_ylim(0,100)
ax.set_ylim(0, np.ceil(coins_list[0]*1.0/1000000/10)*10)
plt.show()