VAROOM gives you the “VROOM! ” Warum?
The financial markets (including the crypto-currencies markets) have been VROOMing about recently. Do you need some “VROOM!” to catch up with the markets? You may want to consider my VAROOM, which sounds like “warum”, the German word for “why”. Why?
Because VAROOM stands for
Velocity & Acceleration Realistically Operating On Money
Just like a Lamborghini going “VROOM!”, the markets moves in a certain direction with some speed, and that is called “velocity”. When it speeds up, it is called “acceleration”. However, financial markets are noisy. So we need to filter out the noise, for example, with an Exponential Moving Average, or some other kind of filter.
In a bullish market, the velocity is positive. In a bearish market, the velocity is negative. When the acceleration is in the same direction as the velocity, the trend is getting stronger. When the acceleration opposing the velocity, the trend is slowing down.
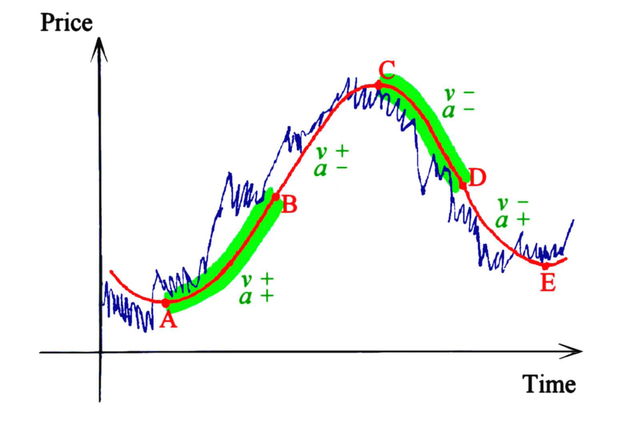
In the diagram, the points A, C and E are turning points, while B and D are what George Soros would call “inflexion points”. Those of us who are experienced traders know that it is easier to make money when it is getting more trendy. These would be the parts between A and B, or between C and D. Realistically, it is easier to make money when the trend is accelerating, so long as you get in before the majority does. After inflexion point, making money is like squeezing blood out of stone, only to realise the blood is your own.
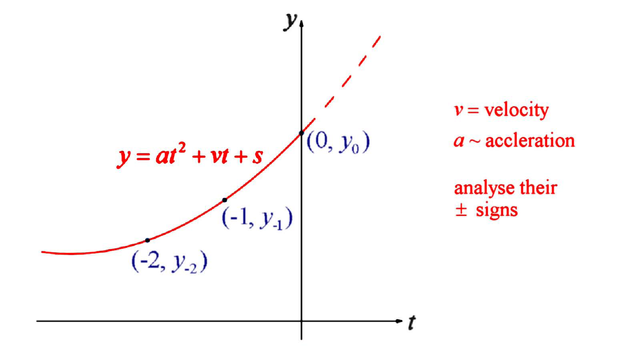
After filtering out the noise, we hopefully obtain a smoothed curve, for example some moving average. Using the current data point and two previous data points and assuming a quadratic curve, we can mathematically solve for the velocity v (the first derivative) and the acceleration a (the second derivative). Those of you who have paid attention in your high school mathematics classes should be able to figure out the formulas for these. Since acceleration is the second derivative (the derivative of the derivative) another way to measure acceleration is to take the velocity of the velocity i.e. the difference of the differences.
An "inflexion point" is just a point after which the acceleration changes from positive to negative, or vice versa (from negative to positive). Old Georgie did not define mathematically what he meant by “inflexion point”. However, using my VAROOM formulas, we can actually calculate and measure the trend and identify when we are past the inflexion point. When your trading system is past an inflexion point, you should begin liquidating i.e. taking profits and/or reducing your trading size.
Those of you who are observant may realize that the second derivative is actually 2a and not a. But actually, what really matters is the + or – sign. a has the same sign as 2a. What we can do is to make sign indicators for the velocity and the acceleration. A sign indicator takes the value 1 when the quantity is positive, -1 when it is negative and 0 when it is zero. You can construct such indicators from each of your short term, mid-term or long term moving averages, if you use a multi-timeframe approach.
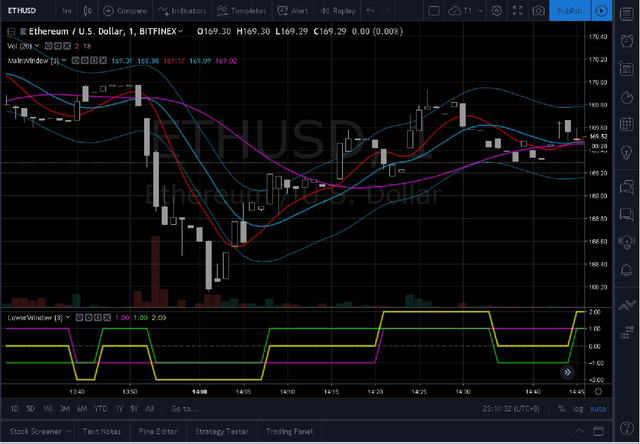
This diagram shows and example of the signals in a real market. On the bottom panel, the green line is the long term velocity sign indicator, whereas the violet line is the acceleration sign indicator. When you add up the two indicators, you get the aggregated yellow line. When the yellow line is zero, it is wise to stay out of the market or trade with smaller size. When the yellow line is positive, you buy dips and sell rallies, or buy and hold. When the yellow line is negative, you sell rallies and buy dips, or hold a short position (if possible). So the times to milk the market as much as possible is when the yellow signal is not zero.
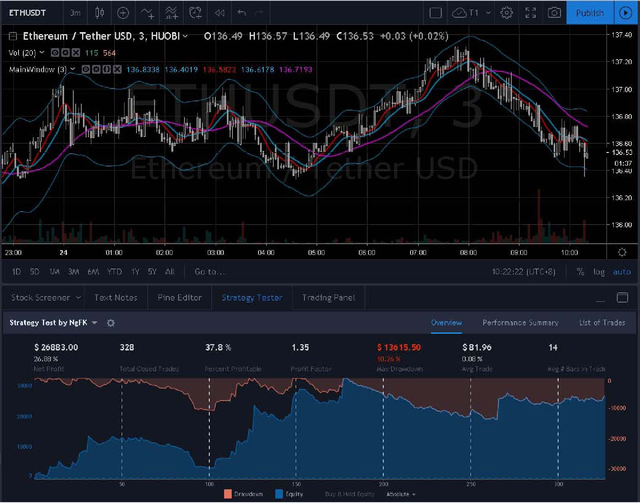
Using TradingView, a simple back-test of my aggregated yellow indicator on ETH vs Tether on the Huobi exchange produced 26.88% profit over about 6 days. In this test run, I had not included trade management (e.g. trailing stop loss / profit stop) and risk management (e.g. allocation of risk capital, number units to trade). If I did, the results would be even better. TradingView is actually not the best platform to thoroughly test trading ideas and 1 minute chart is as low as I can go on the time-frame. Nevertheless, this proves that my idea is basically sound, shows promise and warrants further investigation and research.
More room for VAROOM to “VROOM!”
So, what are some of the things we can try out with VAROOM?
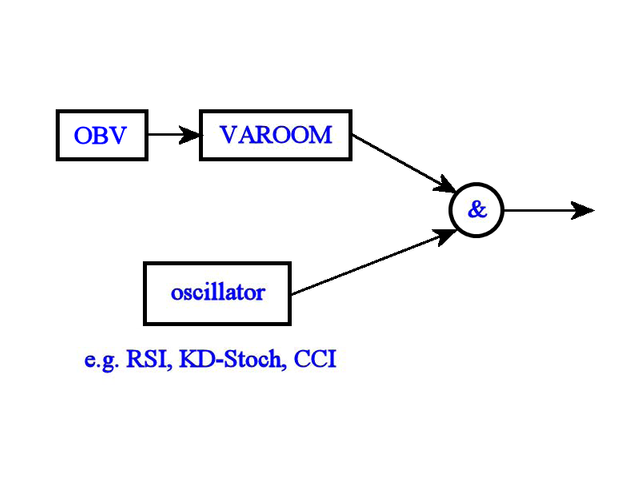
One thing we can do is to apply VAROOM to a volume-based indicator (e.g. OBV) and use an oscillator (e.g. RSI, KD-Stochastics, CCI) to time the entries / re-entries into the markets.
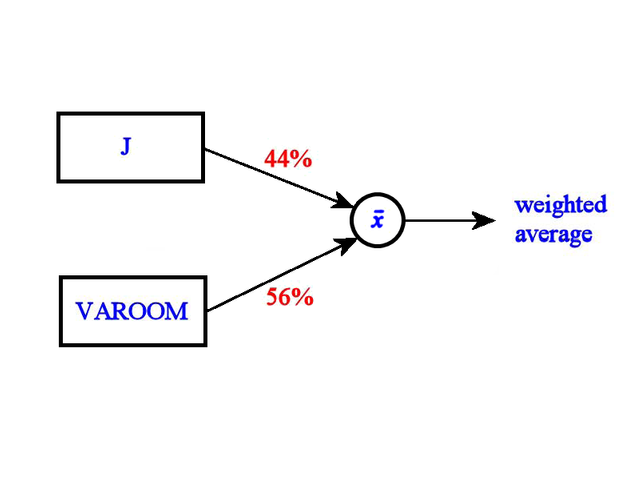
If you have an existing system(s) (e.g. “J”), you might want to run it beside a VAROOM-based system and take the weighted average of the system(s) based on their relative historical performance (e.g. Sharpe ratio). Taking average spreads out the risk, as different systems have different strengths / weaknesses under various market conditions which are always changing.
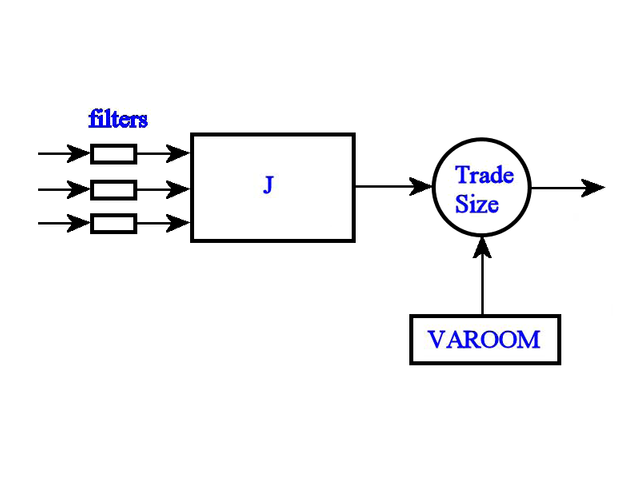
You can apply filters before inputs into your current system, and then VAROOM to determine trade size based on the strength of the market trend. So you allocate more units (trade more aggressively) when trend accelerating. This is when the trend is confirmed but before the crowd rushes in. Allocate less units or do not trade when trend is decelerating, when it is harder to make money as you are just picking up the crumbs when the giants have left the table.
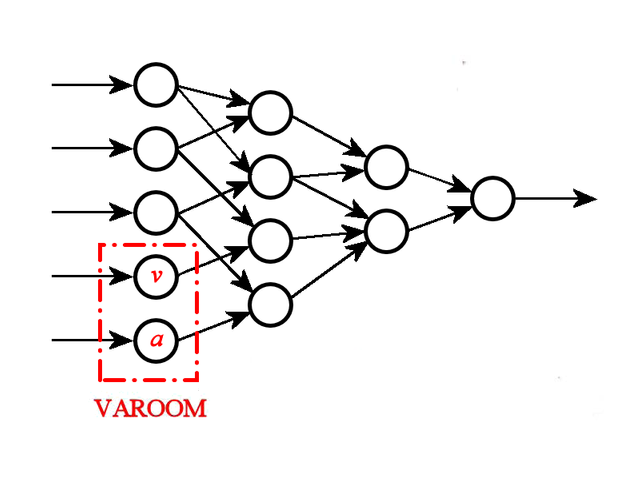
Another idea you can try is to incorporate VAROOM as part a neural network and then use market data to train it. That leaves the neural network to detect patterns that are not surfaced by VAROOM, and/or work out VAROOM’s importance relative to other factors in real-time dynamic data.
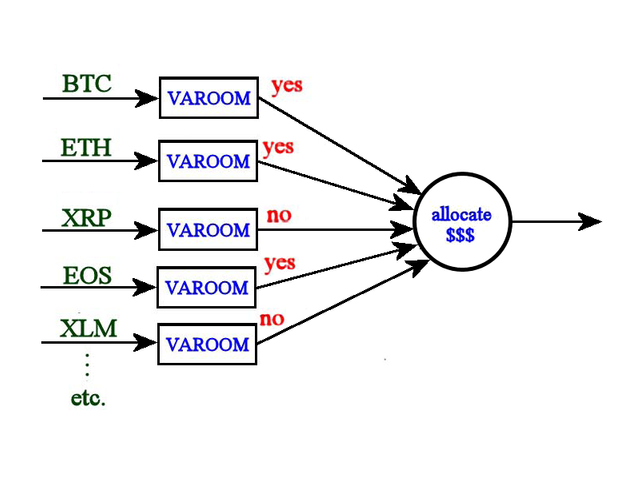
One more idea I can think of is to use VAROOM to scan through all the different instruments / currencies that you trade and then select those that are trending, and then allocate capital according to relative trend strengths of the selected ones.
Any comments or any other ideas? Please feel free to comment below, or to contact me at [email protected]
Congratulations @tradersharpe! You have completed the following achievement on the Steem blockchain and have been rewarded with new badge(s) :
You can view your badges on your Steem Board and compare to others on the Steem Ranking
If you no longer want to receive notifications, reply to this comment with the word
STOPCongratulations @tradersharpe! You received a personal award!
You can view your badges on your Steem Board and compare to others on the Steem Ranking