Indicator #68, The Petroleum Indicator - Black Diamond Bearish Composite Index
Black Diamond Research offers composite indexes to help investors quantify risk and anticipate cyclical market trends. Our tools help our clients to maximize profits from stock market investing while minimizing portfolio risk. We have selected, categorized, combined, and weighed dozens of variables to structure our composite indexes. For more information, please visit us here.
If you are a crypto investor, it is essential to gauge traditional financial market conditions because the coming financial crisis may have a sharp impact on the crypto space.
The following is an extract of our latest monthly report. It presents an indicator that we want to share (component of the Black Diamond Stock Market Bearish Composite Index). We would highly appreciate an upvote if you have found it interesting.
Indicator #68: Petroleum Indicator #2
We closely monitor oil prices because petroleum is an excellent economic barometer and anticipating tool.
A decline in oil prices can suggest either:
an offer excess, which may be positive for the economy, as it increases the consumer’s buying power (bullish for the broad US stock market);
or declining demand, which may imply that the economy is entering into a slowdown/recessionary state (bearish for the broad US stock market).
In both cases, the oil industry is impacted and can potentially damage the local economy. If the fall in prices is sharp enough and durable, the oil sector hits the economy in multiple ways (unemployment, bankruptcies, etc.) and even globally (default on the sovereign debt of oil-dependent nations, geopolitical tensions in the Middle East, etc.).
Our observations of history have taught us that when oil prices fall sharply, it is not always exclusively linked with demand/offer unbalance: “something is wrong, somewhere.”
As we explained in our July 2017 Report:
On October 31, 2014, the BOJ announced the expansion of its bond buying program, Quantitative and Qualitative Monetary Easing #2 (QQE2), to buy 80 trillion yen of bonds a year ($699 billion). Japanese stocks skyrocketed by more than 30% in the following 8 months as the yen was aggressively devalued.
The problem with such huge devaluations is that it exports deflation to the US as the value of the USD sharply increases versus the yen. As mentioned previously, with ZIRP, investors rush on carry trading: they borrow the currency with the lower interest rate (yen) and use the funds to purchase a currency with better yield (USD).
Unfortunately, such strengthening of the dollar has a consequence: commodities prices, which are quoted in USD, can sharply fall. The announcement of QQE2 from the BoJ had a devastating effect on oil prices.
If you haven’t yet, we invite you to read this article in The Street, co-written with Dan Dicker, which exposes the consequence of oil crashes on equity markets here. The piece is pretty old now but still current, more than ever. As demonstrated, an oil prices collapse has always preceded a fall in equities since 1987.
In order to construct some indicator combinations, we use different commodities and oil data such as the PHLX Oil Service Sector Index (OSX) and the CBOE Crude Oil ETF Volatility Index (OVX).
How did the S&P 500 Index behave after periods during which the OSX corrected while the VIX (volatility index) remained low? Poorly, as a broad fall in US equities has usually occurred after such “data alignment,” as shown on the chart below:
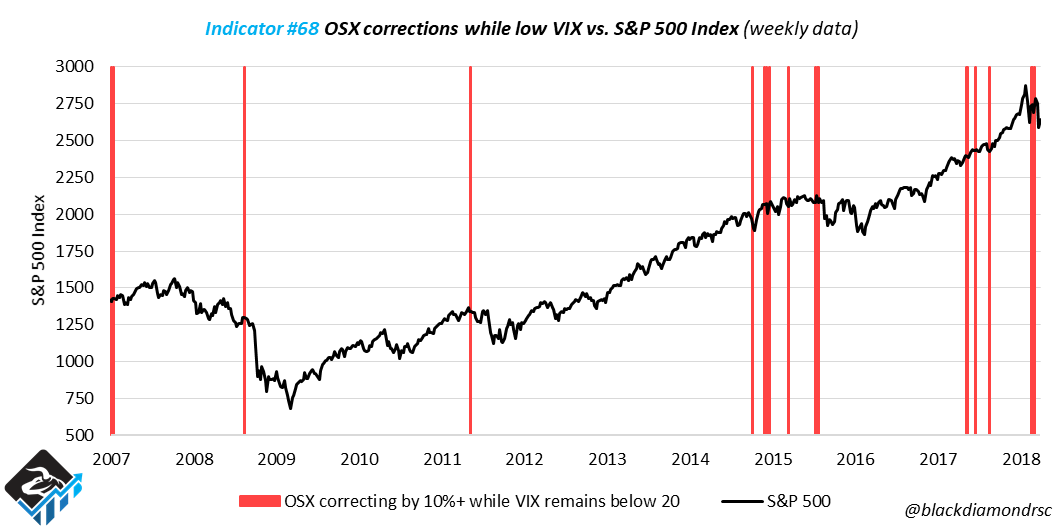
This indicator warned of corrections that occurred in 1998, 2001, 2008, 2011 and 2015.
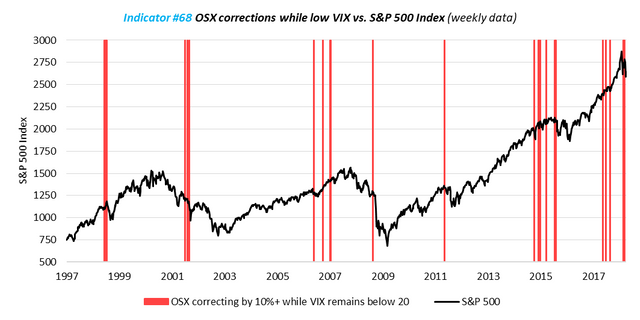
Indicator #68 is currently in alert status within the Bearish Composite Index.
This report has been designed for informational purposes only. Nothing contained herein constitutes a solicitation, offer, or recommendation by Black Diamond Research or its affiliates to buy or sell any securities or other financial instruments or provide any investment advice or service. Such offers can only be made where lawful under applicable law. Black Diamond Research does not render investment, tax, accounting, or legal advice, and nothing contained in this post should be construed as such. Investors must make their own investment decisions based on their specific investment objectives and financial position, using such independent advisors, as they believe necessary.
The data and analysis contained herein are provided “as is” and without warranty of any kind. Black Diamond Research, its employees, or any third-party data provider, shall not have any liability for any loss sustained by anyone who has relied on the information contained in any publication published by Black Diamond Research. No report shall be considered a solicitation to buy or sell any stock, security, or asset. This communication reflects our opinions as of the date of this communication and will not necessarily be updated as views or information change.
The indexes published by Black Diamond Research assess risk levels and are a quick way to gauge what our indicators and studies are suggesting. The higher the risk of the Stock Market Bearish Composite Index, Bear Subindex, Correction Subindex, and other components, the more likely the market is to decline and to be sold. The higher the risk of the Stock Market Bullish Composite Index, the more likely the market is to increase and to be bought. We do not suggest using our tools in any kind of mechanical way. They are meant to help support any existing technical or fundamental research you may be doing.