#39 - I don't care, I'm bear
What is up boys and girls?
If you have been following these daily posts, yesterday's scenario has broken down:
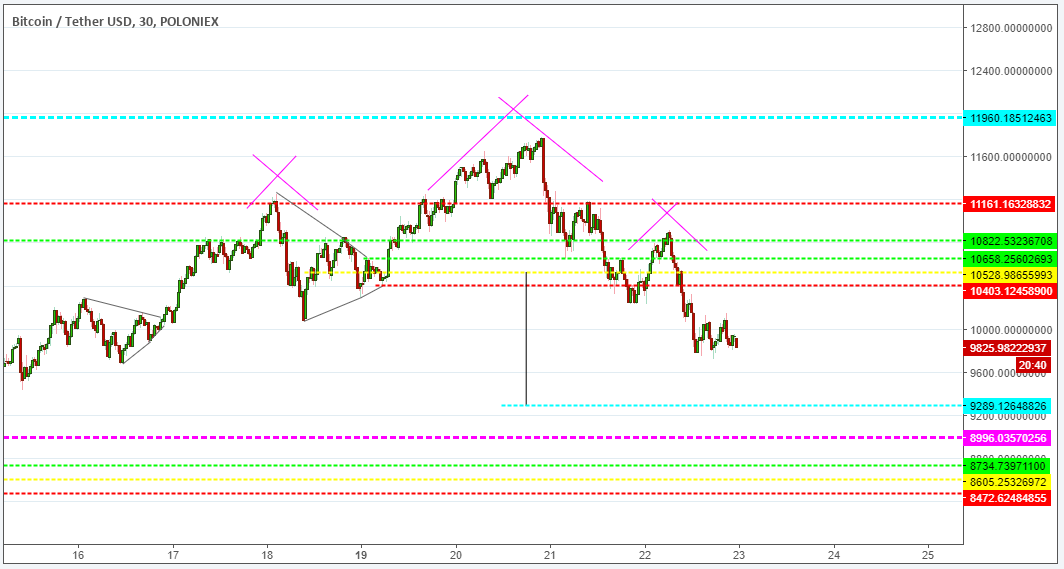
The pattern displayed above is a classical technical pattern of head & shoulders which measures the current target to a Bitcoin rounding 9200$. The measured move is taken from the top distance of the head up till the 10500$ neckline (yellow dotted line) which brings us down to the blue dotted line.
Nothing much to add, in case you want more recurrent updates join my Telegram channel where I try to post in real time (whenever it is possible):
On a bigger timeframe, we are potentially looking at a bear market for the coming weeks (or months) as potentially seen on the RSI indicator on the Weekly chart:
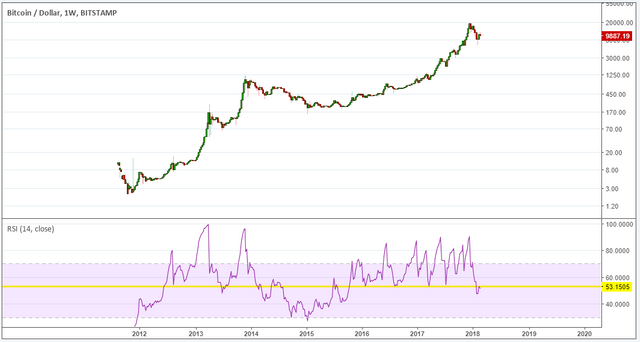
Remember, previous resistance often turns into present support (and vice-versa). The 53 level on the RSI indicator which has proven to be strong support time and time again for the past two years, has been broken and arguably, turned into resistance.
This would suggest a bear market period for Bitcoin and in my view, for the entirety of the cryptocurrency market as well.
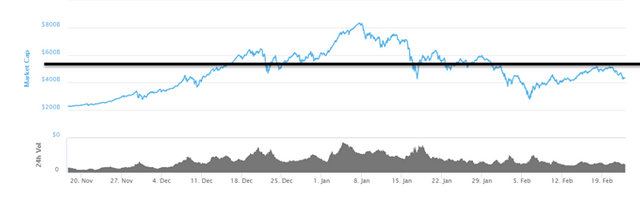
This is also suggested if we take a look at the full graph of the cryptocurrency market cap which presents a head & shoulders scenario with a neckline around the 500 billion$ mark. Below you can see the development of this call:
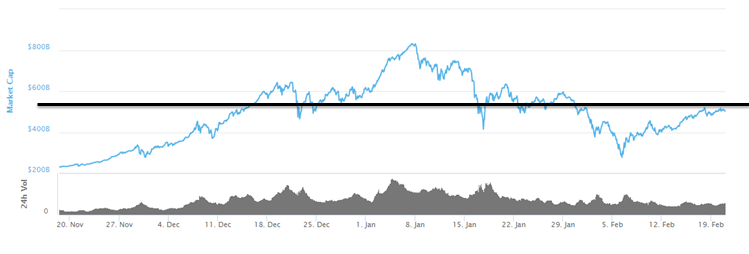
This suggests an entire decrease of the total size of the market down to around 180 billion$, mostly coming from Bitcoin loosing USD value and consequently, the same would happen to the rest of the altcoins as these are measured against Bitcoin.
A bold statement I know, but let's be honest: who would storm in to buy big amounts of Bitcoin at the moment?
As always, I'll keep you guys posted on Bitcoin's price action development (even for the upside potential don't worry). There are many ways one can profit from a market (going up or down), you just need to make sure you are aware of what you need to be looking for.

Disclaimer: Cryptocurrency trading is highly speculative in nature which can mean currency prices may become extremely volatile. Cryptocurrency trading carries a high level of risk and may not be suitable for all investors. It is possible that you will sustain a loss of some or all of your initial investment so never risk capital that you cannot afford to lose. You acknowledge and agree that no promise or guarantee of success or profitability has been made between you and BeIndependent [bit by bit].
►Free e-book on How to Start Your Cryptocurrency Journey: http://beindependentbb.com
►Join us on Telegram: https://t.me/beindependentbb
► Find us on Instagram: https://www.instagram.com/beindependentbb/
►Find us on Twitter: https://twitter.com/beindependentbb

Does VOLUME confirm that pattern? I dont think so..
I'm not sure which graph are you referring to.. The volume on the small head & shoulders seen on Bitcoin had a powerful break to the downside:
Note the huge two red candles once that 10500$ level was broken.
The volume on the entire market cap graph is hard to evaluate..