Steem price surpassed 50-day moving average
I think there are not many people who have invested in Steem and are satisfied with its performance. Admittedly, it fell far short of expectations. We need to detect mistakes and act accordingly.
We know that the 50-day moving average is a very important indicator in technical analysis. Steem price has not been able to break above the 50-day moving average for a long time. However, in the last few days, it has overcome this difficult hurdle and relieved its investors a little. It gave hope for the future.
In 2022, the Steem price exceeded the 50-day moving average many times in 2022. However, this was not a permanent increase. After the big drop in December 2021, Steem price has had difficulty in increasing upwards.
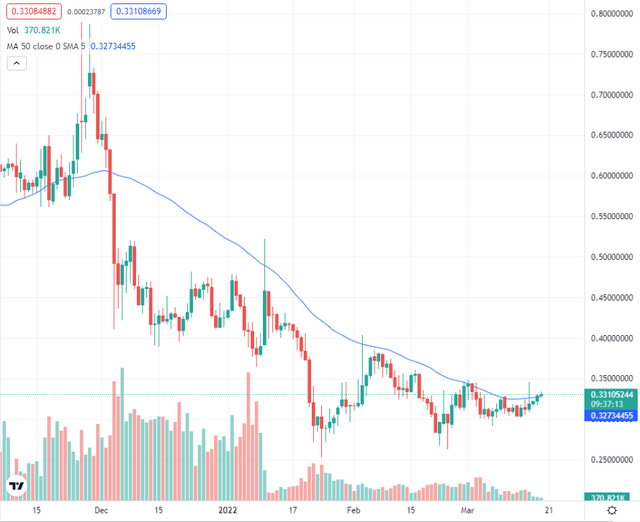
As you can see in the chart I got from Tradingview, in the 2nd week of January, the Steem price exceeds the 50-day average, then immediately drops below the 50-day average.
In the first week of February, the Steem price crosses the 50-day moving average, then declines. There is no permanent increase.
At the beginning of March, the 50-day average is exceeded again. Again, there is a decline. In other words, it acts as an average resistance of 50 days. Steem price is having a hard time exceeding this price.
Steem instant price is currently $0.332. The 50-day average price is $0.327. For a few days, this resistance seems to have been overcome. However, for us to be sure of this, a very serious rise must occur.