Unsettling 150 Year Cold in Our Crop Zones
This video was originally published 16/11/2019
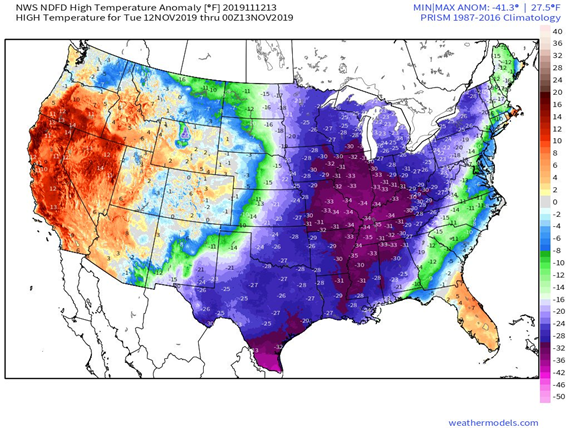
Forecast maps displaying ridiculous below normal temperatures of more than 30°F, this early in the season.
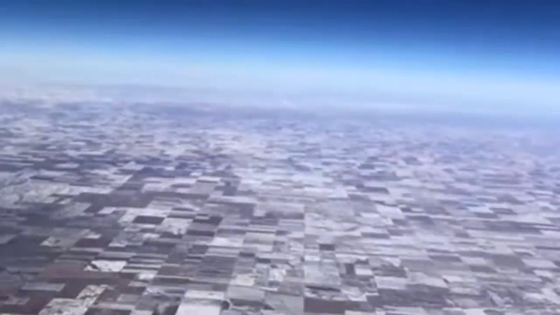
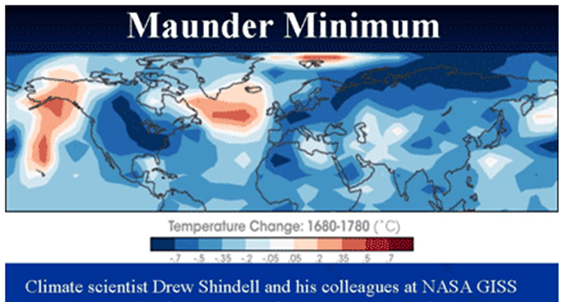
Last year 2019 even on October 31st, Midwest farm fields were blanketed in deep early snow for the third year in a row, as shown in this aerial image; and that hindered the harvests. Following that the coldest Polar Blast in 150 years a century-and-a-half, swept through during this integral time of harvest. A shift is now setting in place with extreme snow and cold during the final maturation stage of crops in the fields, exactly the same areas as the Maunder Minimum 1640–1710.
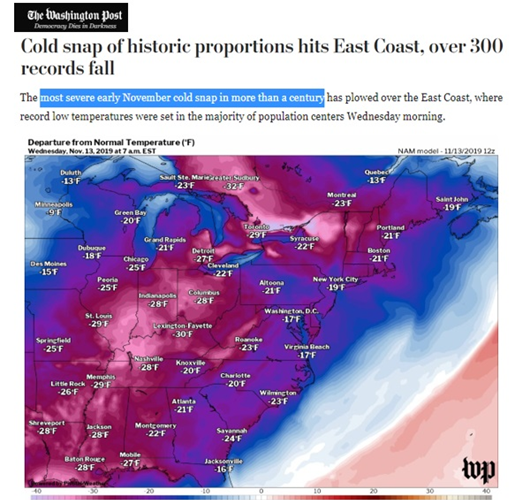
Washington Post reported this as the most severe early November cold snap in more than a century, but I think they are still under reporting this.
WaPo keep using the word ‘cold snap’ as a description, and seem to refuse to write the exact time scale, which is a century and a half. Anyhow, this broke all records as far back as our nation has, all records from all the temperature stations across the United States, including some of the oldest temperature stations in the Northeast US. Somehow it was a cold snap.
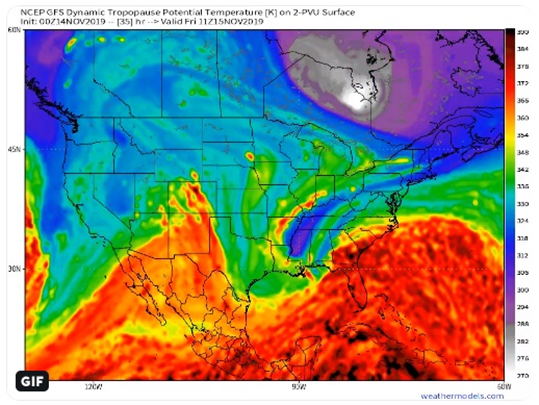
Arctic temperatures in Autumn stretched all the way to the Gulf of Mexico.

As shown in this tropopause model, broken off pocket of extreme cold polar air, seen as white blob on the map, is at the border of Canada and the US, south of Hudson Bay. Hence, there are two areas of ripping cold.
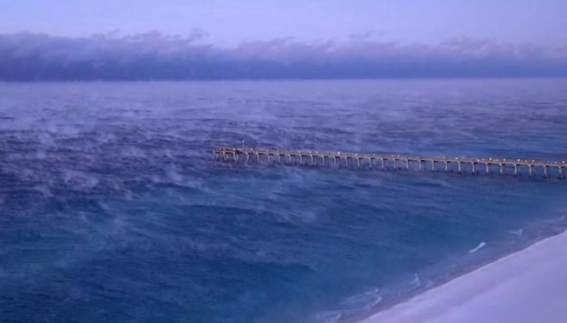
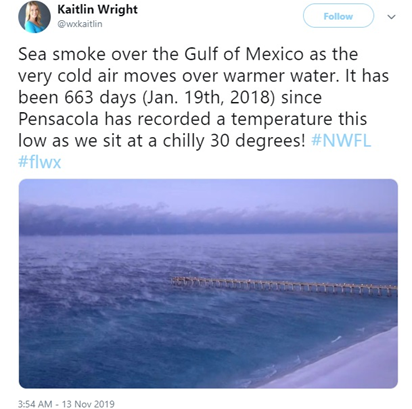
Spooky Sea smoke forms over the Gulf of Mexico as polar air moves over warm Gulf waters.
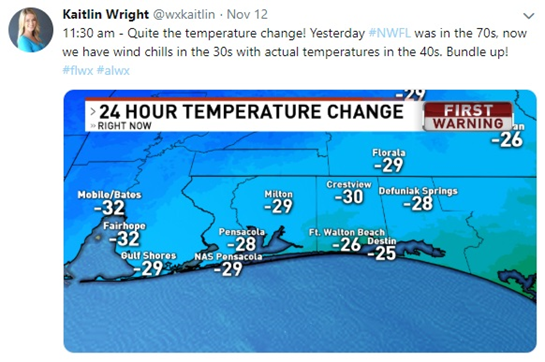
On top of that, the 24-hour temperature change was as much as 32°F in a single 24-hour shift.
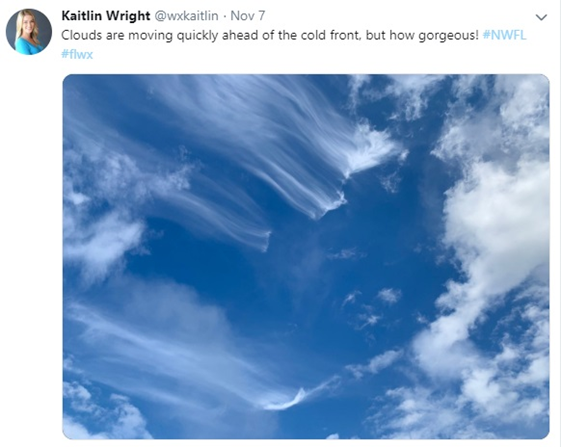
Stunning photos from Kaitlin show the cold front blasting ahead. I think some of us recognize exactly what those clouds are with dissipating striations in ghostly angelic clouds.
Fun fact from the National Weather Service, New Orleans, 13th of November had morning low temperatures that smashed all of last winter’s temperatures, including January, February, and the entire coldest depths of 2018–2019 winter. Take heed, it is not even the second half of November, and it still broke every cold record in the southeast US. Do you see a pattern of cold far above the normal is different areas of the N. America?
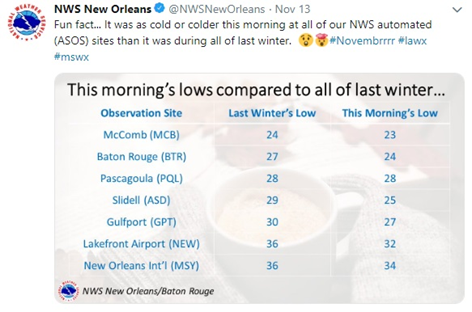
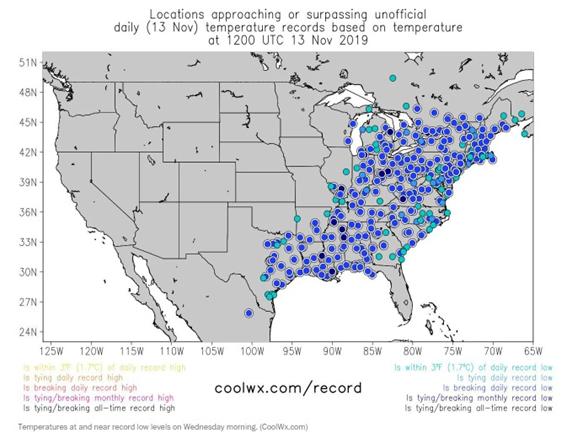
You can see how this cold front swept across the US, even without looking at the temperature gradients or the GFS models. Just follow the low temperature records smashed, as this moved through the central Midwest Plains and over the crop growing zones from the east coast down to the Gulf of Mexico.
As for Mexico, this is the coldest in almost 200 years, breaking thousands of old cold records this early in the season, thus, using ‘unprecedented’ to describe this is still an understatement.
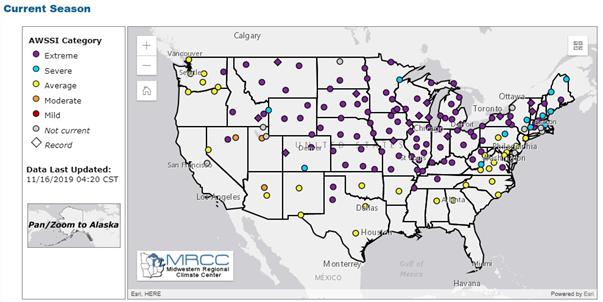
By the way, Maxar have a full list of ‘extremes’ like this. This site is maintained by the Midwest Regional Climate Center, and to be included in the list, an anomaly has to be way above a certain anomaly.
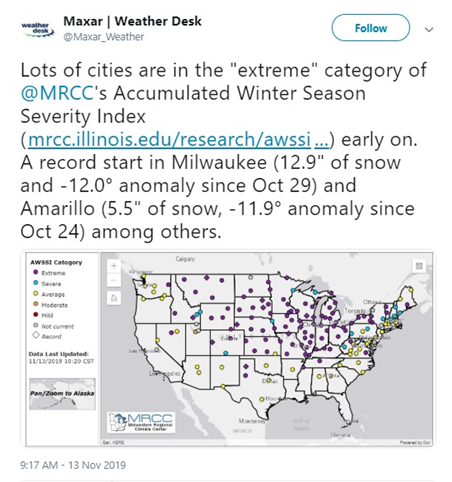
FYI: An 18°F difference or more is required to be included in the “extreme” category; and dark purple dots in the map are where the extreme conditions happened. As shown, these are at 35–40°F under the normal temperatures. By the way, I like focusing a little bit in the Northeast US because they have the longest temperature records.
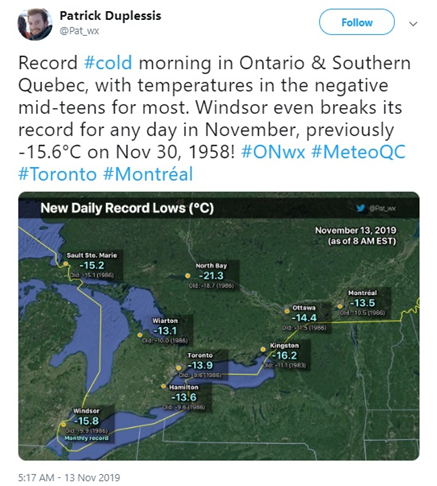
Looking back, Canada experienced an arctic blast, the white blob on the tropospheric model in the first part of the article. Ontario and Southern Quebec experienced -15°C temperatures (10°F). In addition, to smashing these all-time cold records going back to the 1870’s on the border up in Canada is something very unusual.
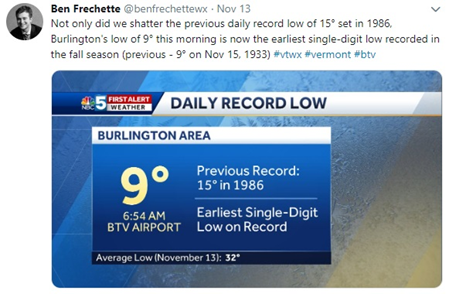
Then on the Daily Record Low, Burlington Vermont had its earliest single-digit low on record, and again, some of these records are stretching back to the late 1800s.
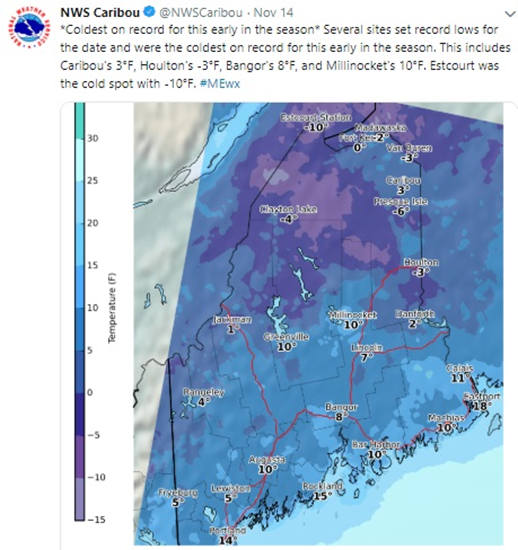
Likewise, Maine had its coldest day on record this early in the year; and also dozens of all-time records were shattered. It did not only break the old record by 1–2°F, but literally shattered it, because this time it is 12°F cooler than the previous record that stood for 130 years.
Yet talking heads in the corporate media are still insisting that the Grand Solar Minimum does not exist, and the problem lies in CO2 accumulations that are going to make the planet a hothouse. The truth is, we are getting back to 200-year cold temperatures right now.
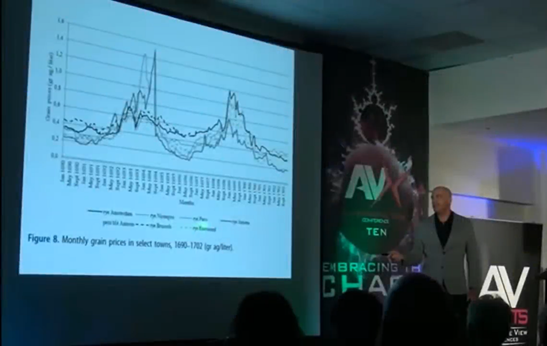
That is why when I was presenting at Alternative View 10 in London, I posted this food price reconstruction from 1650 to 1710 across five different capital cities in Europe. It shows as crop yields declined from shorter growing seasons food prices sometimes tripled or were even 7x higher. The similarity today is that N. Hemisphere harvests that are being affected at a faster rate already and in the same way described by chronicles in the 17th century.
My question is, what are the first things you’re going to stop spending on when your food prices double or triple? Trace that back to the rest of the economy and see how that is going to shrink parts of it, when you stop spending, and others, just like you, stop spending on the same goods and services.
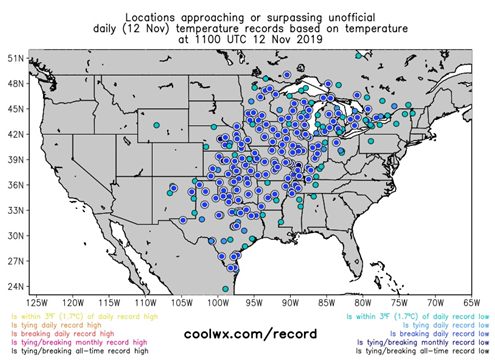
Moving on, this is an incredible visual graphic to show areas in the U.S lower 48 that are colder than Alaska.
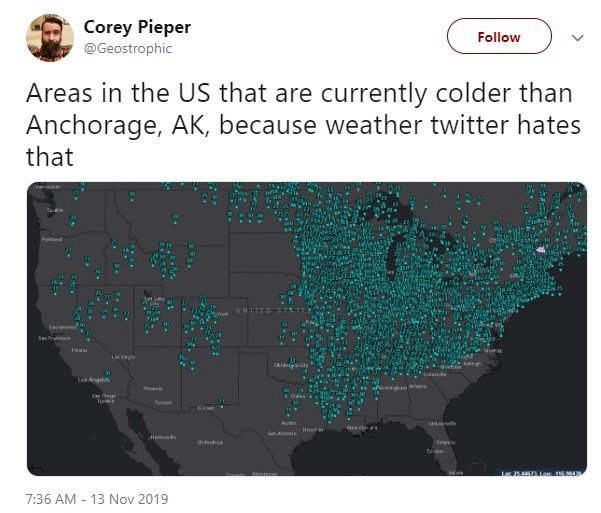
You can see, most of the U.S is early record cold. Everywhere you see green dots had an old temperature record that was broken. This seems to match up with what was seen on the extreme forecast, and with temperature charts WX Weather was putting together along with NOAA, and National Weather Stations.

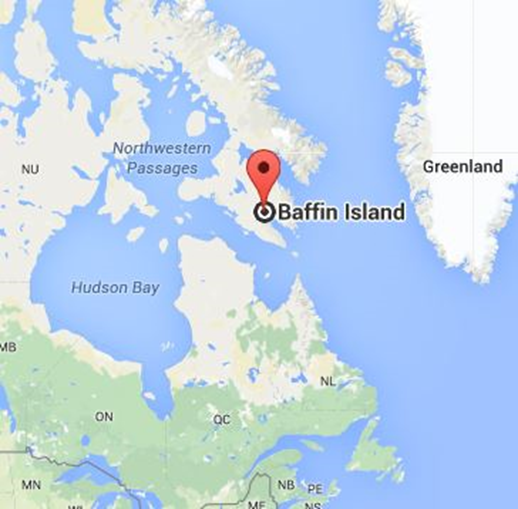
In any case, my wake-up moment doing this article was looking at the ‘Snowiest Months on Record’ in Nunavut, in Baffin Island in northern Canada. October 2019 was the snowiest month on record they ever had, and obviously, it gets colder in December and January, when the temperature is at -40.
The trend seems to be longer winters with more extreme cold and heavier snows. This has happened since 2017–2017 winters a new pattern forming bringing shorter growing seasons and lower crop yields.
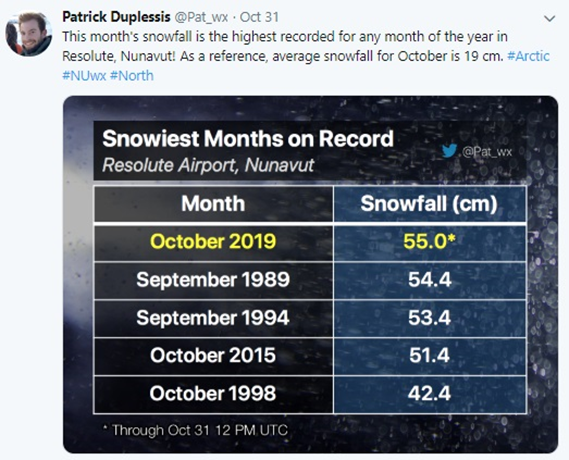
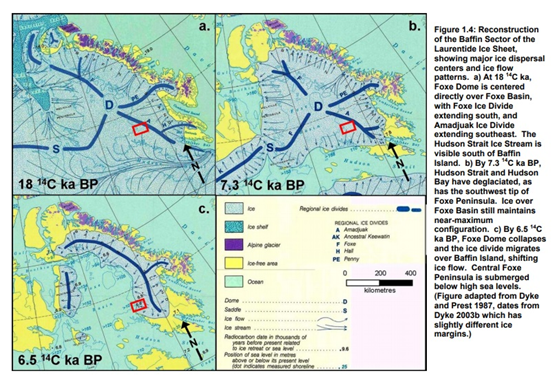
So the 2019 snow season broke all-time snowfall records in Baffin Island. I encourage you to search for Leonard Nimoy’s talk regarding the seed point of the last glaciation over N. America was Baffin Island.
Look at research done on Baffin Island, pointing to the Laurentide Ice Sheet Glaciation starting point, I have a PDF on this and listed the links about this story.
This is an eye-opener because it poses yet another very important question: Is this the beginning of a larger cycle that is going to intensify over the next decade?
Consider Europe’s cold temperature records were broken at the same time as N. America, from the 9th of November to the 16th, particularly, Norway, Sweden, and Finland. I thought it was supposed to be record warm up there. Weren’t we lectured about that?
Thanks for reading, I hope you got something out of the article. If you like more content like this, I produce the tri-weekly Mini Ice Age Conversations podcast of a 30-minute in-depth analysis on the GSM you can take on the go through out your day.
Mini Ice Age Conversations Podcast
iTunes: https://itunes.apple.com/us/podcast/adapt2030
Soundcloud https://soundcloud.com/adapt-2030
Libsyn http://adapt2030.libsyn.com/
MIAC (#285) Piggybacking a Natural Cycle Then Nobody is to Blame
https://adapt2030.libsyn.com/miac-285-piggybacking-a-natural-cycle-then-nobody-is-to-blame
For the bi-weekly Grand Solar Minimum climate update newsletter from myself, David DuByne, (ADAPT 2030) jump over to oilseedcrops.org you can enter your email and sign up. Move your mouse around for about 10 seconds and this box will pop up.
Join ADAPT 2030 NEWSLETTER http://www.oilseedcrops.org
“Help support the adapt 2030 channel on brighteon so we can keep Grand Solar Minimum information free to access.”
https://www.brighteon.com/channel/adapt2030
Support ADAPT 2030 by Visiting Our Sponsors
ADAPT 2030 & My Patriot Supply 2-Week Food Supply with 92 servings
www.preparewithadapt2030.com
True Leaf Market Heirloom Seeds ADAPT 2030 True Leaf Market Link
ADAPT 2030 Amazon Grand Solar Minimum Book Store https://www.amazon.com/shop/adapt2030
Upheaval: Why Catastrophic Earthquakes Will Soon Strike the United States https://amzn.to/2E7KbBt
It’s Not CO2. It’s Not You, It’s the Sun — ADAPT 2030 Limited Edition Design. Wearing this shirt may trigger Al Gore. https://teespring.com/stores/adapt-2030
*** Today’s Story Links ***
Cold snap of historic proportions hits East Coast, over 300 records fall
https://www.washingtonpost.com/weather/2019/11/13/cold-snap-historic-proportions-hits-east-coast-over-records-fall/
(Unofficial) Record-breaking temperature across the USA
http://coolwx.com/record/usamovie.week.php
(Unofficial) Record-breaking temperature across Europe
http://coolwx.com/record/europemovie.week.php
US Map frozen and new cold records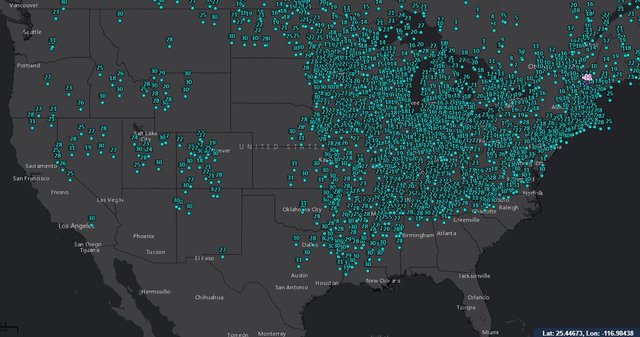
Weather gif and model runs for temperature
https://twitter.com/RyanMaue
Temperature departure from normal
Cold front clouds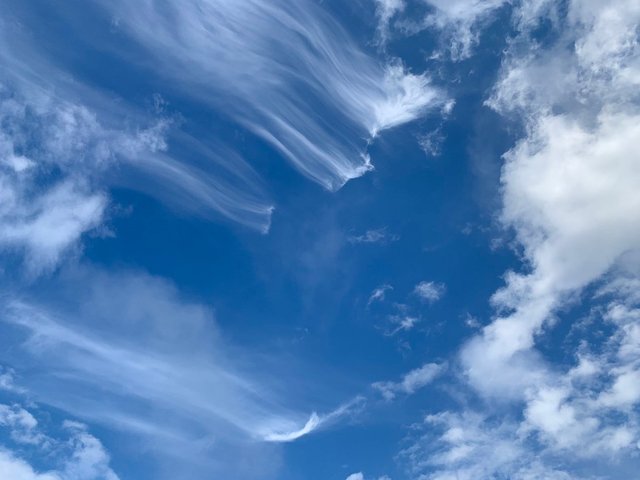
RESEARCH: ACCUMULATED WINTER SEASON SEVERITY INDEX (AWSSI)
https://mrcc.illinois.edu/research/awssi/indexAwssi.jsp.
Laurentide Ice Sheet Baffin Island QUATERNARY GEOLOGY OF BLUEGOOSE PRAIRIE, BAFFIN ISLAND, NUNAVUT
https://core.ac.uk/download/pdf/56376056.pdf
*** ADAPT 2030 Social Media Links ***
PATREON https://www.patreon.com/adapt2030
YOUTUBE ADAPT 2030 Mini Ice Age 2015–2035 Series on YouTube
BITCHUTE https://www.bitchute.com/hashtag/adapt2030/
BRIGHTEON https://www.brighteon.com/channel/adapt2030
STEEM https://steemit.com/@adapt2030
MINDS https://minds.com/ADAPT2030
MEDIUM https://medium.com/@globalcooling
FB https://www.facebook.com/Miniiceage
TWITTER https://twitter.com/adapt2030
I think 🤔 this will be a longer cycle just because of the weirdness that has come so far , But thanks to people like you we’re prepared and growing our own foods 👍