Elliott wave analysis for EURUSD: 4hr tf
It was mentioned in my previous for the EURUSD that it was possibly in a minute wave ((c)) position that is part of an Elliot wave combination (W-X-Y) structure that commenced on April 2, 2018.
Price action did not invalidate last week’s commentary by closing above ~1.24104, so it is likely that the EURUSD will continue its current 4hr bearish scenario. A correction (3 wave move) of the current price swing downwards from ~ 1.24002 would also increase the chances of the EURUSD selling off.
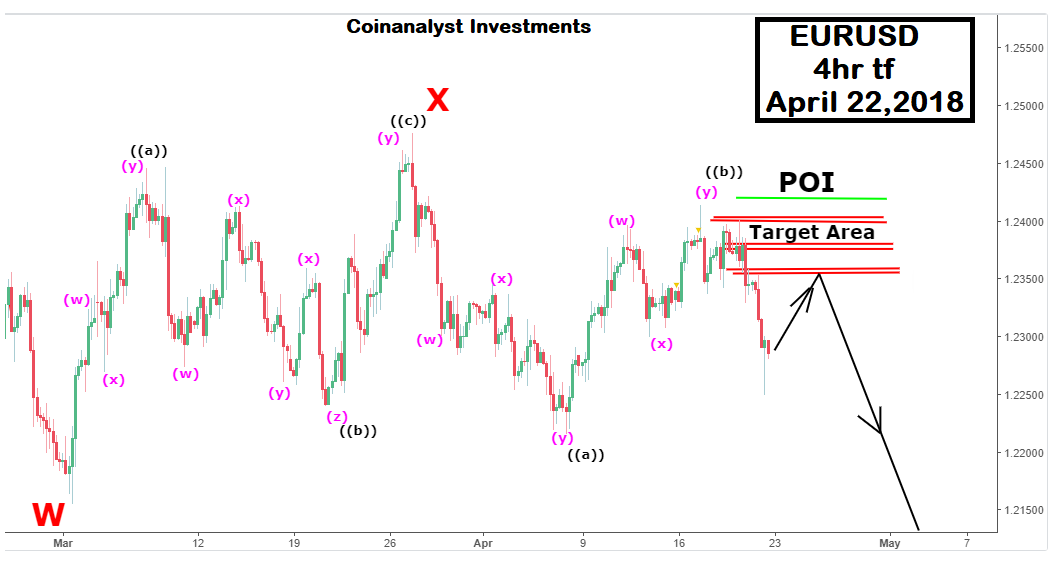
Any correction (bullish move) in the EURUSD would be expected to terminate within the Target area shown in the post for last week and is also indicated in this analysis.
This analysis supports EURUSD targeting this region again and then continue to sell off.
The least target or the sell off is expected to be the price low (~1.21545) made on March 1, 2018 and a much lower target would be ~1.20582.
Point of invalidation (POI) for the analysis is a price close above ~1.24203
P.S. Failure of the EURUSD to follow through with a sell off and price moving back to only close above ~1.24242 but no further, would make me start to think of a triangle which is acceptable as a guideline for the last leg of a combination ( W-X-Y) structure.