Chart School - EthLend ($LEND) outlook & OTA #1 - Intro
"You know what music is? God's little reminder that there's something else besides us in this universe, a harmonic connection between all living beings, every where, even the stars."
-Robin Williams, August Rush
While this quote may seem out of place given the topic, I do believe there's something universally pure about mathematics and the way it both governs and guides us at an intuitive level -- whether we realize it or not. For the disagreeable among you, I'll share an example or two.
Consider a star athlete who can't do simple algebra. Since I'm unapologetically American, I'll use real football (college, not pro) to make the point. As the QB snaps the ball, his receivers leave the line of scrimmage accelerating quickly. The quarterback has just seconds (3-5 steps) to scan the field and make a decision, usually planning to throw almost immediately. His receivers are now moving at full speed and he throws down the sideline. Catching the ball in stride, his receiver makes the catch. But how did the QB make that throw it if he can't do the requisite math? How can someone run a loop of newtonian physics equations through their head, find the proper vector angle/magnitude of the pass, then release in mere seconds? Who masters physics before they figure out algebra?
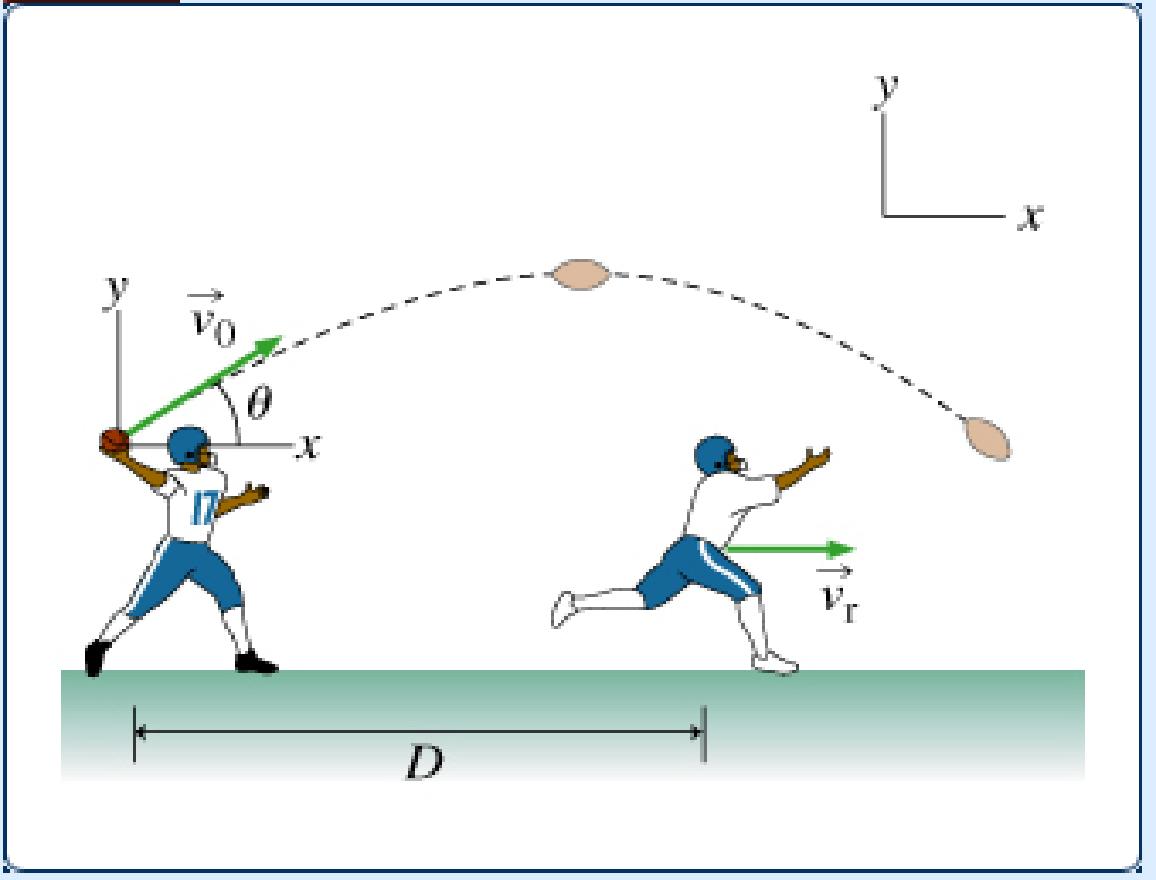
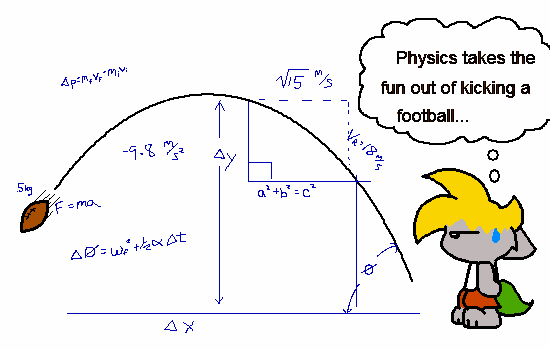
Well, no one. But also everyone. Our bodies have to learn, so the universe teaches us about its laws through intuition, observation, and trial-and-error. We become a part of the pattern in order to understand it. Much like with entering a new physical realm, entering the digital trading one can be daunting. But a conceptual grasp on the importance of modeling helps... because everything has a pattern, the only things that change are variables.
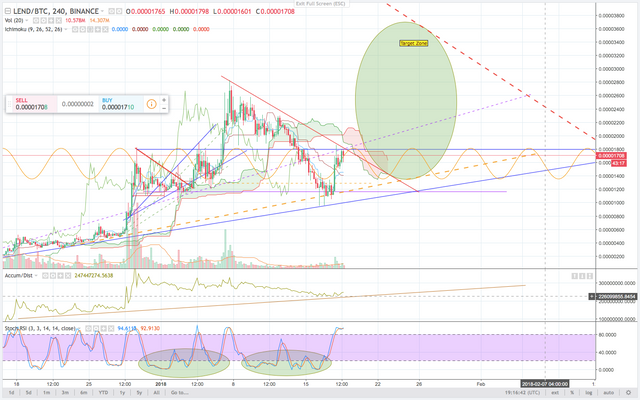
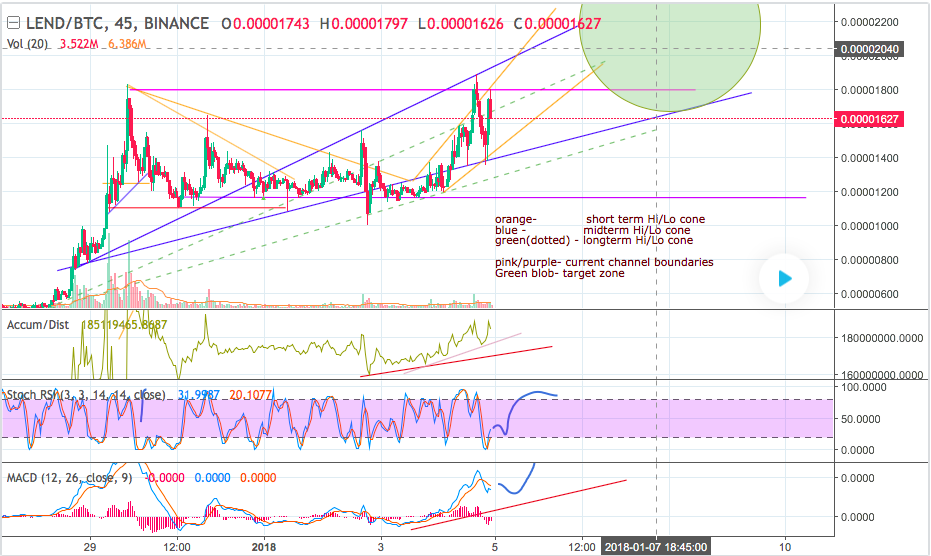
As an exercise take a look at my charts below. Note where I decided I wanted to place support/resistance lines. Notice the behavior (price action) prior to and after bouncing off. Then take an empty chart and try it yourself. After you've set your S/R lines, go to diagonal ones. After that, estimate a best-fit line and see how it plays out. Tweak it until you begin hitting enough data points to meet a certain confidence threshold, and boom -- this simple model has become useful in helping identify market cues.
I'd say you're onto something, Morpheus
But I'll dabble:
Here's one currently in play and should be open trading through tomorrow.
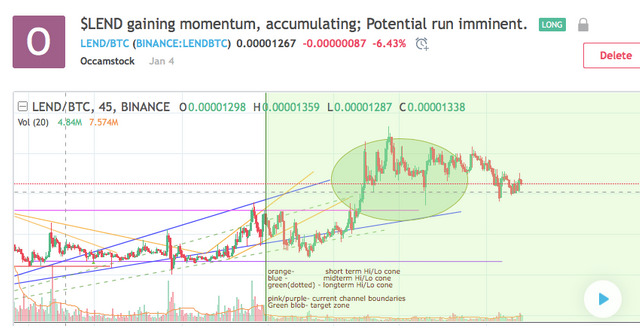
and a previous version made on Jan 4th (pre then post):
With sufficient data, predictive models can very accurrately monitor intangible aspects of markets like emotion and behavior. In the realm of technical analysis, free of manipulation, there are times when you can almost feel the roller coaster about to swing -- at least thats how I experience it. Through this thread of posts I hope to give a better understanding of how to develop a style, and I'll share what I've learned in my journey so far.
You've gotta start somewhere, and nothing beats experience. Try it out on tradingview and get learning today!
Until next time.
-OB
Important note: that trade advice expires the 23rd if you're cautious and the 25th if you're dangerous. Regardless it should be fine, just misread timing.
Also I'm not a financial advisor etc. etc.