Ethereum Price Forecast: Ether Trades Near Major Inflection Point

(image source Google.com)
Hello steemits today i am going to talk about ETHEREUM price forcast i hope it will help you.
This past week, there was a decent rise in ETH/USD above the $200.00 pivot level. The pair climbed above the $230.00 resistance and traded as high as $254.66 before starting a downside correction.
ETH/BTC also recovered nicely above the 0.0320BTC and 0.0340BTC resistances. The pair even broke the 0.0350BTC resistance and is currently trading in a tight range. The next major hurdle for buyers is at 0.0380BTC.
Ethereum price weekly Analysis ETH
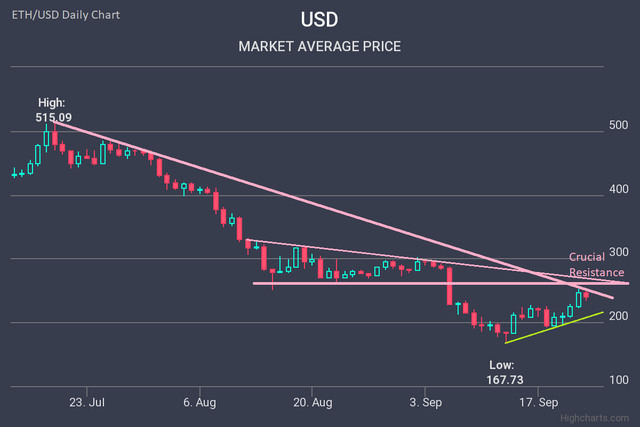
Let’s start with the daily chart of ETH/USD to understand the recent recovery from the $192.00 support. The pair traded higher with four back-to-back green candles above the $200.00 pivot level. Ether broke the $210.00 and $230.00 resistance levels and tested the next major barrier near $250.00-255.00.
The 23.6 Fibonacci retracement level of the major downward move from the $515.09 high to $167.73 low is also near $250.00. More importantly, there are two bearish trendlines in place around the $270.00 level.
Therefore, the $250.00-270.00 region could act as a strong hurdle for Ether buyers. Should they succeed in surpassing $270.00, the price will most likely accelerate gains toward the $300.00 and $350.00 levels.
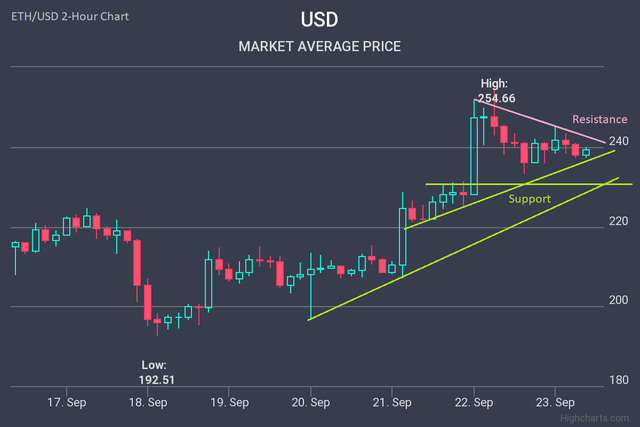
Dropping down to the 2-hour chart of ETH/USD, there is a key support forming above the $230.00 level and a connecting bullish trendline. Below the trendline, the price could test the next support at $220.00.
Ether Price Analysis Chart
To the topside, there is a bearish trendline formed with resistance at $242.00, above which the price may possibly retest the $250.00 level. The current price action indicates that Ether’s price is trading in a positive zone above $230.00.
In the medium term, a successful daily close above $270.00 could place Ether in a strong uptrend. If not, there is a risk of a pullback toward the $220.00 and $200.00 support levels.
Weekly Resistance Levels
$250.00 and $270.00
Weekly Support Levels
$230.00 and $220.00
Daily RSI
The RSI is currently near the 45 level.
Daily MACD
The MACD is slowly moving into the bullish zone.
Legal Disclaimer: I am not a financial advisor nor is any content in this article presented as financial advice. The information provided in this blog post and any other posts that I make and any accompanying material is for informational purposes only. It should not be considered financial or investment advice of any kind. One should consult with a financial or investment professional to determine what may be best for your individual needs. Plain English: This is only my opinion, make of it what you wish. What does this mean? It means it's not advice nor recommendation to either buy or sell anything! It's only meant for use as informative or entertainment purposes.