ETH/USD Weekly forecast: ether achieves new milestone
ETH/USD Weekly Forecast: Ether Achieves New Milestone
It’s a new all-time high in Ether price versus the US Dollar as a lot of strength was noticed in ETH/USD and ETH/BTC.
Key Highlights
There were amazing gains noted in Ether price against the US Dollar and Bitcoin, as the bullish trend got hold.
A new all-time high at $21.81 was formed in ETH/USD, as buyers had an upper hand.
The daily chart of ETH/USD suggests further gains with a possible test of $22.
Technically, the daily chart indicators are super bullish, and signaling further upsides in the near term.
Ether Outpacing Bitcoin
In major news, the SEC rejected the request to list Bitcoin ETF, which resulted in a downside move in BTC/USD. This actually helped Ether, as it became the first choice of investors during the decision time.
It resulted in a solid upside rise in Ether price, as it moved above the last major resistance above $20 and created a new all-time high at $21.81.
Yesterday, we saw how Ether price developed a new wave higher, and moved above 61.8% Fibonacci retracement level of the last decline from the $20.09 high to $16.26 low.
It later gained further strength and managed to break the last swing high at $20.09, having a 4-hour close above the stated level. As the price continued it’s gains, it created a new all-time high above $21.50 at $21.81.
All the charts are signaling positive moves in ETH/USD, and ETH/BTC is also enjoying decent gains, as Bitcoin price remained under a bearish pressure.
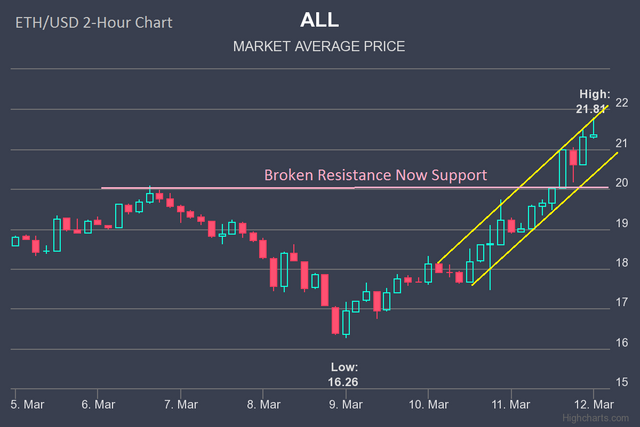
The 2-hour chart of ETH/USD shows how the price broke a major resistance area, currently following an ascending channel pattern. The price at $21.81 found resistance near the channel resistance, and currently under a minor correction.
On the downside, the $21 level can now be considered as a support area, followed by the last pivot at $20.
The daily chart of ETH/USD clearly highlights Ether’s strength, and pointing further gains in the near term. The pair formed a couple of breakout patterns before an upside move and remained in the bullish zone.
Weekly Resistance Levels
$21.81 and $22.00
Weekly Support Levels
$20.00 and $18.50
Daily RSI
The RSI technical is above the 50 level, and likely to head north.
Daily MACD
The MACD is well in the bullish zone and poised to extend gains.
Have a great day,
@BlockChainSupporter
original content :
By Aayush Jindal
March 11, 2017 ETHNews.com
https://www.ethnews.com/analysis/03-12-2017-ethusd-weekly-forecast-ether-achieves-new-milestone