Wake UP Ethereum! - Technical Perspective.
When is the moon launch?
It has been a few days since I have had the time to sit down and do a thorough analysis of any of the crypto currencies for the steemit community. I want to look at Ethereum with you guys.
All of the information I provide is intended for education to help the good folks on steemit learn how we use charts to predict, ideally with some degree of accuracy the price movement of a given equity or asset class.
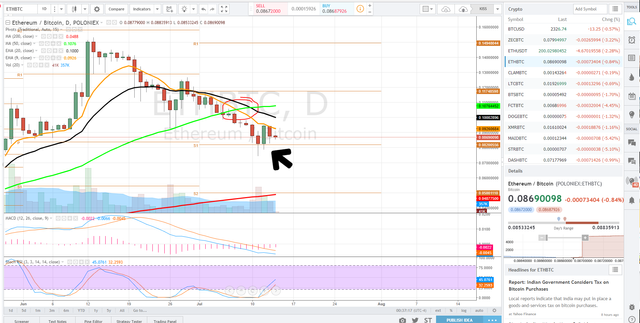
Lets first have a gander at the Ethereum Daily chart, this gives us an overview of what the prevailing trend in price action has been. It's been not good for holders, excellent for short sellers and mediocre for traders (the crypto market generally has been mediocre the last few weeks if one is not taking excessive risks).
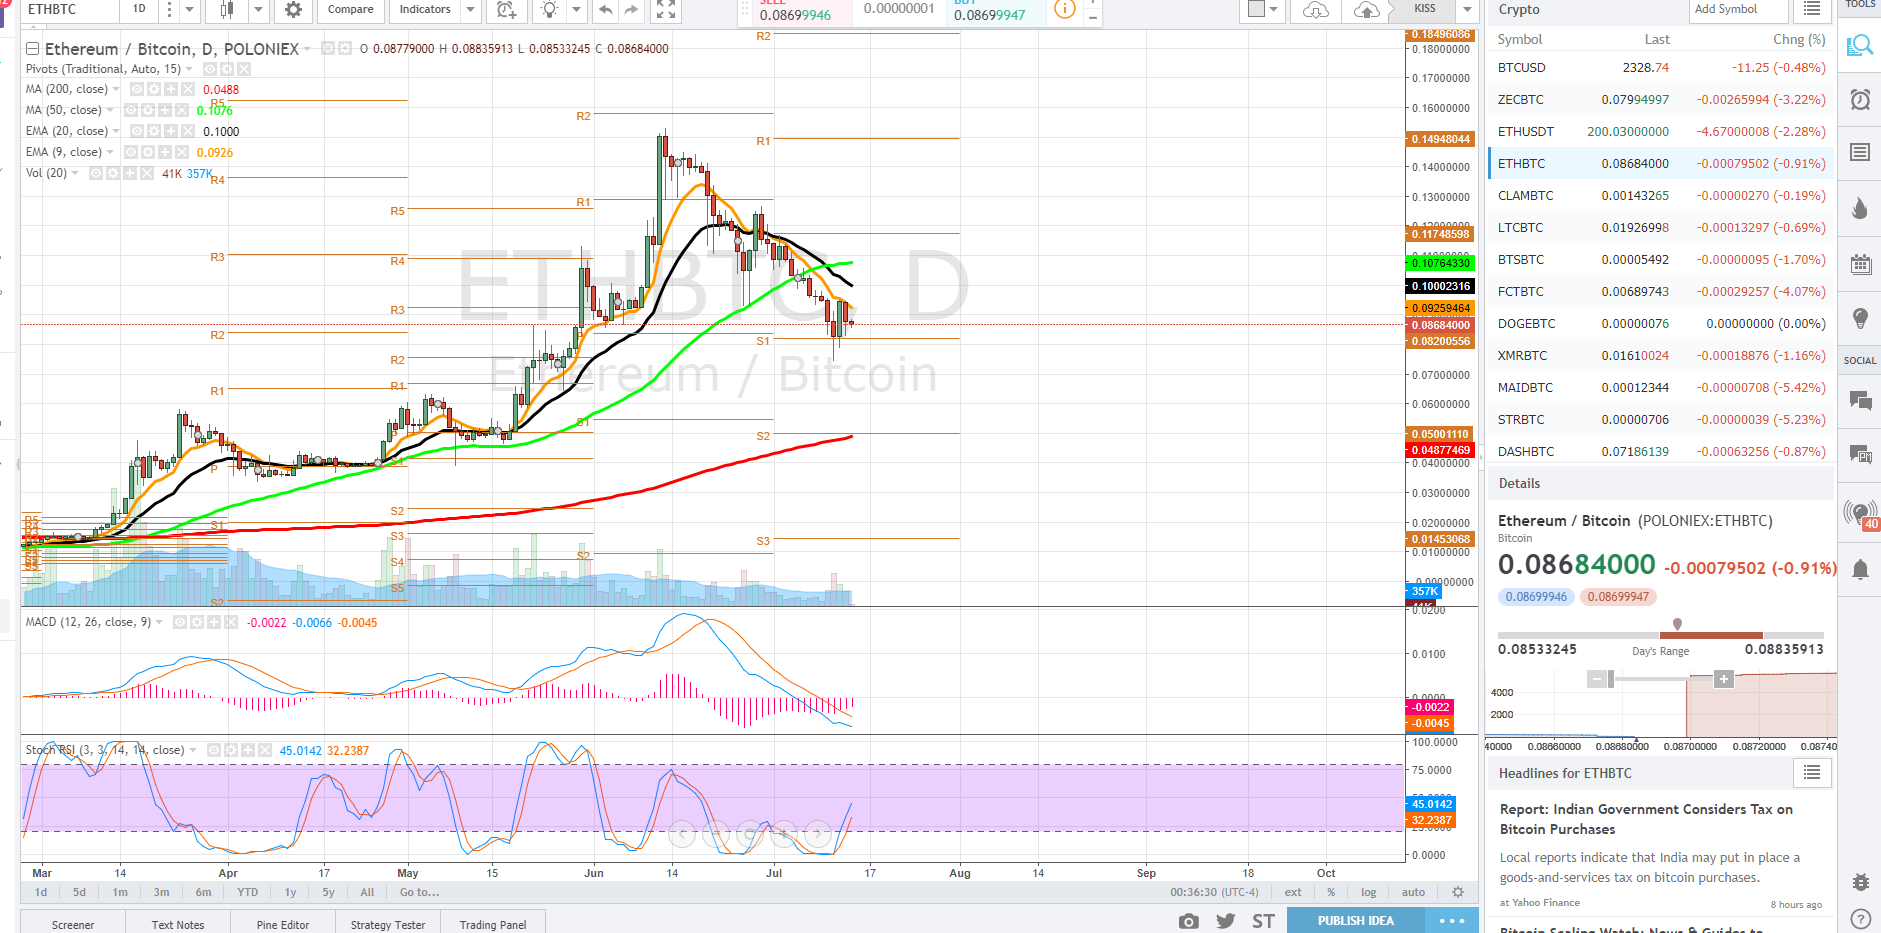
On the daily chart we see quite a few things. For starters, the STOCHASTIC RSI, a momentum indicator I use and is on the very bottom has sprung out of downtrend, and over the coming days, bulls hope this momentum continues. There are a few things to note here, for starters, Ethereum hung on to the historical support line. (My charts use a little algorithm to determine these historical levels). So S1 held, thats great, even better each candle stick was a higher low.
What is concerning if we look a little closer, we had some shorter term moving averages cross below the 50Day moving average. The 9 and 20 day exponential moving averages are critical areas of support and resistance and can indicate a trend shift with a cross above or below, both in price and between all of the averages.
We are looking for the price of Ethereum to push through the 9 and 20 day exponential moving averages to drive them back above the 50 day moving average. This would be very condusive to the longer toerm bull case, for you investors out there.
Million dollar question....well for some maybe I am sure. We have to look intraday for a little more direction. The 1 hour time frame holds the answer I think.
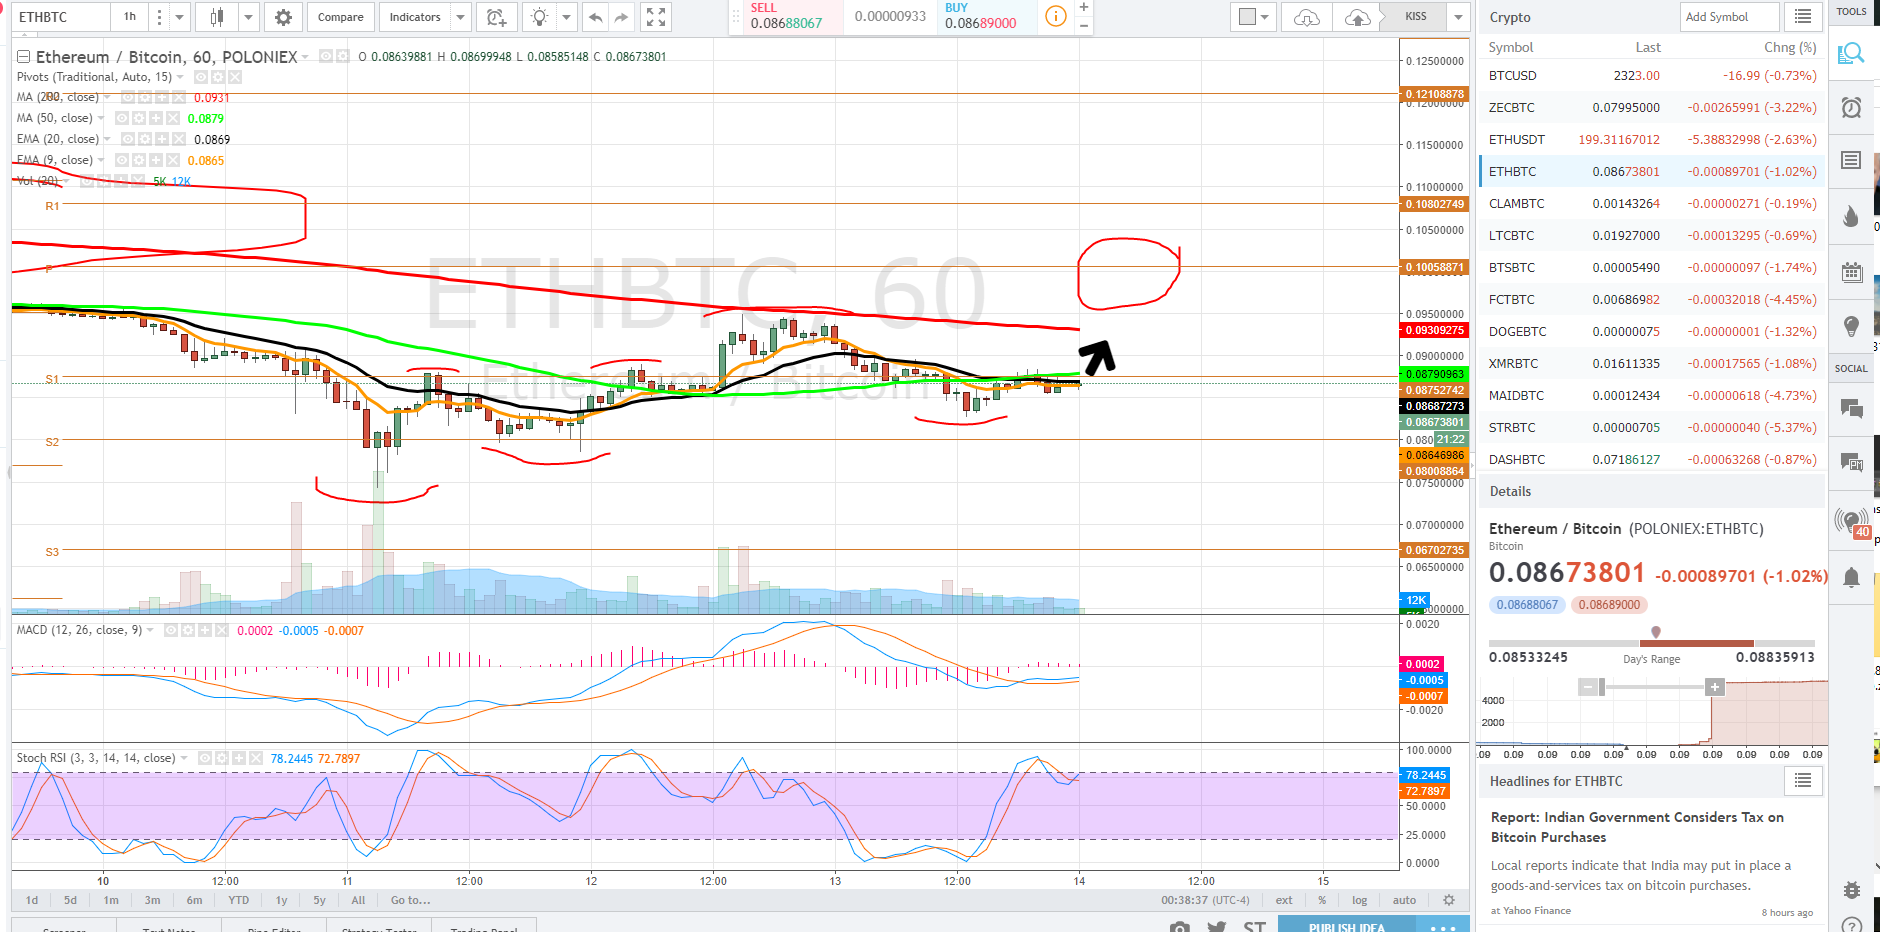
So what are we looking at. For starters I have traced a line under and over a series of higher lows and higher highs. This is price progression. Very positive sign. We are also going to look at the moving averages here. We see the 50 day moving averge (green) is curling up towards the 200 day moving average(red). A cross here would strengthen our bull case and we would go out to the 4 hour chart to start trying to time pullbacks for dip buying.
If you have any questions or want to discuss, hit up the comments section. Technical Analysis is one of my passions, Charts tell the story and price is king.
At the time of this post Ethereum currently trades at approximately $200 USD a 61.8% fibbonaci retrace from the march low to the recent high.
Not Trading or Investment Advice
Hii If You Want to Earn More MOney Just Follow Me Then I wiil Back Follow You Thanks I Vote Your Post Please Vote My Post. And Follow Me
I feel like ethereum is going to have a large increase here within the next two months.
baby steps first friend... doesnt mean one couldnt start building a position