Can we see ethereum 210$ in next 5 days ???
Ascending chart pattern (Bullish Pattern) formed ni Eth/usd Chart. And the Target of this pattern is nearly about 30$, if the price is successfully break the uper resistance line (180$ Resistance).
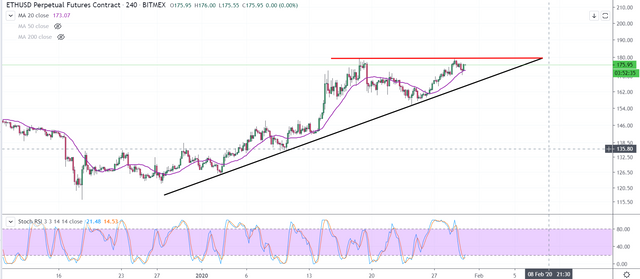
And also the 20/200 day Moving Average are very close to crossover , if the moving averages are successfully crossed, then we also expect a good move in upside direction,
.png)
Join Telegram for quick updates : https://t.me/bttraders