Where Does Price of Ethereum Go From Here
Full disclosure I am a long term holder of Ethereum. I have two charts that I'd like to share today that may show opposing trends. The first is the logarithmic price chart of Ethereum.
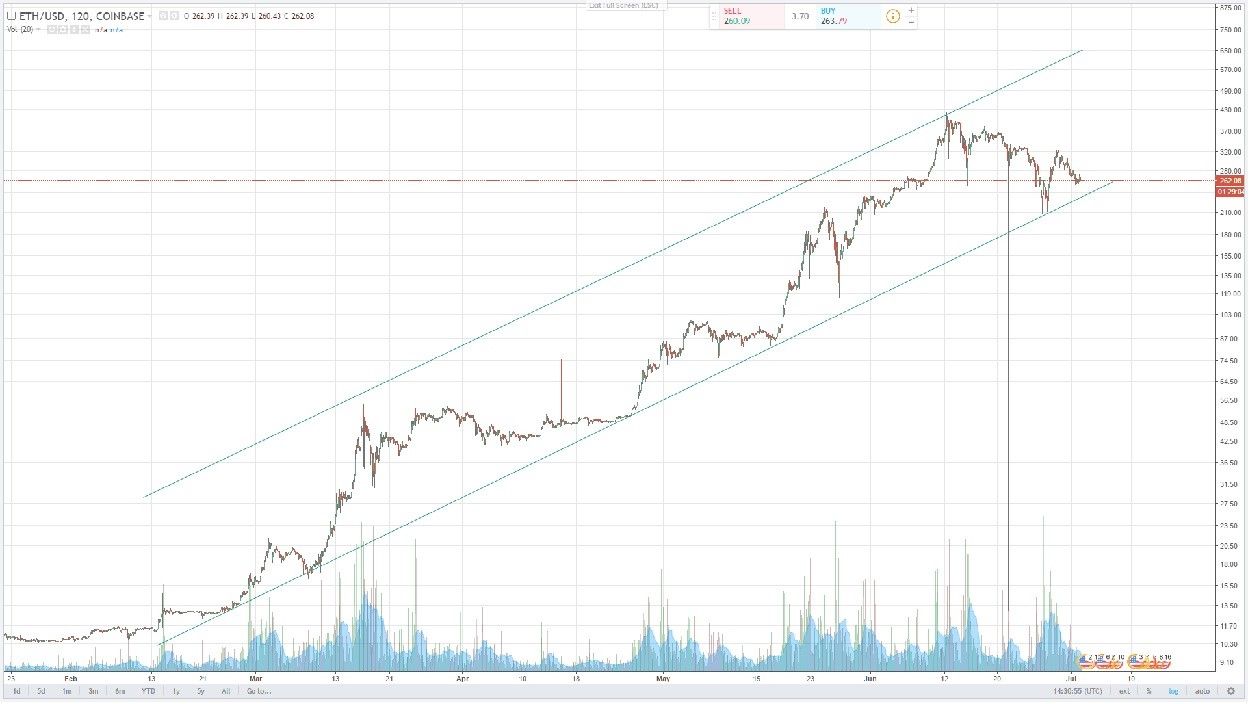
As you can see, there is a well established price channel that started earlier this year as the price broke out. Each and every time over this period, the price has bounced off of the support line, including just a couple days ago. As of today, the price is near the bottom of the channel near support line. This would be a bullish signal. Following an establish trend is always a smart idea, but one other indicator is giving me pause.
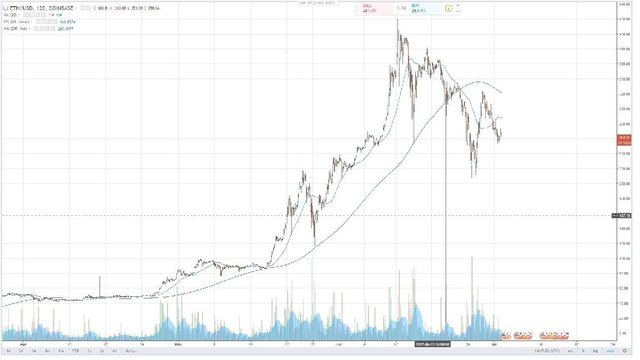
This chart shows the 50-day moving average crossing below the 200-day moving average. This is known as a death cross and is a bearish signal. The death cross happened on June 24th. The price dropped from $324 to the $230s over three days. The price has since recovered a bit and then given some back again. So where do we stand going forward?
I think that the next few days are critical for the near and medium term trend of Ethereum. If the price falls and stays below the established support line of the price channel, then that would confirm the death cross and we are in bearish territory.
But it also looks as if the 50 and 200 day moving averages are already converging again. If this happens and they cross again the other way, that is called a golden cross and is a bullish signal. This would be consistent with the price bouncing off of the support line like it has been doing in the recent past. Death crosses are often false alarms, but we haven't had one in quite some time, so it is important to pause and evaluate.
What are your thought? In the near term are you bullish or bearish?