Ethereum price continued to trade lower against the US Dollar and Bitcoin, and it looks like ETH/USD may continue to face sellers as long as it is below $300
Ethereum price continued to trade lower against the US Dollar and Bitcoin, and it looks like ETH/USD may continue to face sellers as long as it is below $300.
Will the ether fall?
SPONSORED ARTICLE: Tech Analysis articles are sponsored by SimpleFX - Simple as Never Before,
SimpleFX is a robust online trading provider, offering trading with Forex CFDs on Bitcoins, Litecoins, indices, precious metals and energy. Offers and trading conditions simple and transparent.
Key Highlights
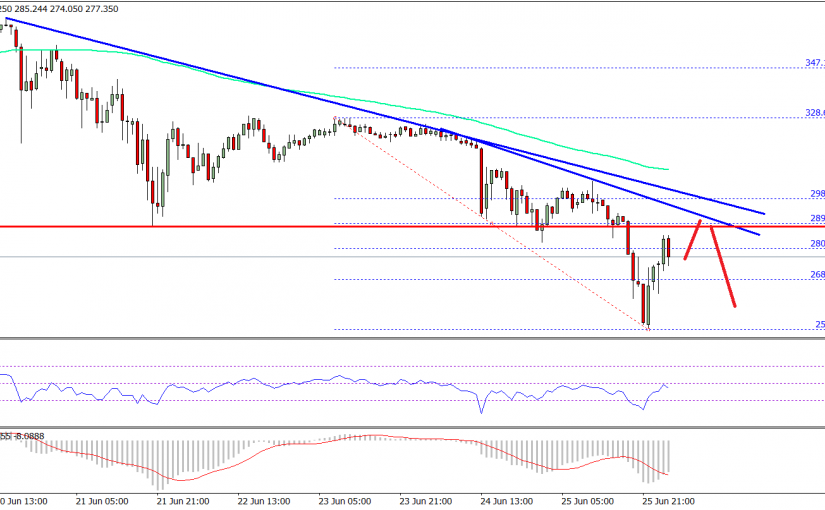
ETH price came under further pressure and moved below a major support at $288 against the US Dollar.
There is a crucial bearish trend line formed with resistance at $289 on the hourly chart of ETH/USD (data feed via SimpleFX).
On the downside, the recent swing low at $250 might act as a support in the near term.
Ethereum price continued to trade lower against the US Dollar and Bitcoin, and it looks like ETH/USD may continue to face sellers as long as it is below $300.
Ethereum Price Resistance
It looks like a major correction wave is initiated for ETH price as it closed below $300 against the US Dollar. The price attempted a minor recovery from a major support area near $288. However, it failed to gain momentum, and faced sellers near $325-330. It also failed to close above the 50% Fib retracement level of the last decline from the $365 high to $288 low.
As a result, the price resumed its downtrend and traded below a major support at $288. It ignited further declines and the price traded as low as $250. It is currently recovering and moved above the 23.6% Fib retracement level of the last decline from the $328 high to $250 low. However, there are many hurdles on the way up like the $280-288 resistance. There is also a monster bearish trend line formed with resistance at $289 on the hourly chart of ETH/USD.
Ethereum Price Technical Analysis ETH USD
Furthermore, the 50% Fib retracement level of the last decline from the $328 high to $250 low is also around the $288 resistance. So, if the price continues higher, it might fail near $288-290 and trade lower once again.
Hourly MACD – The MACD is placed heavily in the bearish zone.
Hourly RSI – The RSI is attempting to break the 50 level, but struggling.
Major Support Level – $250
Major Resistance Level – $288
Charts courtesy – SimpleFX
Disclaimer: The information contained herein is not guaranteed, does not purport to be comprehensive and is strictly for information purposes only. It should not be regarded as investment/trading advice. All the information is believed to come from reliable sources. NewsBTC does not warrant the accuracy, correctness, or completeness of information in its analysis and therefore will not be liable for any loss incurred.
Solid article. Good to see I'm not the only one who thinks like this. The cryptospace definitely feels a bit inflated. However we also said that about the S&P 500 40 years ago This is quite an interesting website I found: https://www.coincheckup.com Every single coin can be analysed here based on: the team, the product, advisors, community, the business and the business model and much more. Go to: https://www.coincheckup.com/coins/Ethereum#analysis To check Ethereum Investment research.