ETHEREUM.. Sideways Correction Opportunity. Sept 20, 2017
Analysis:
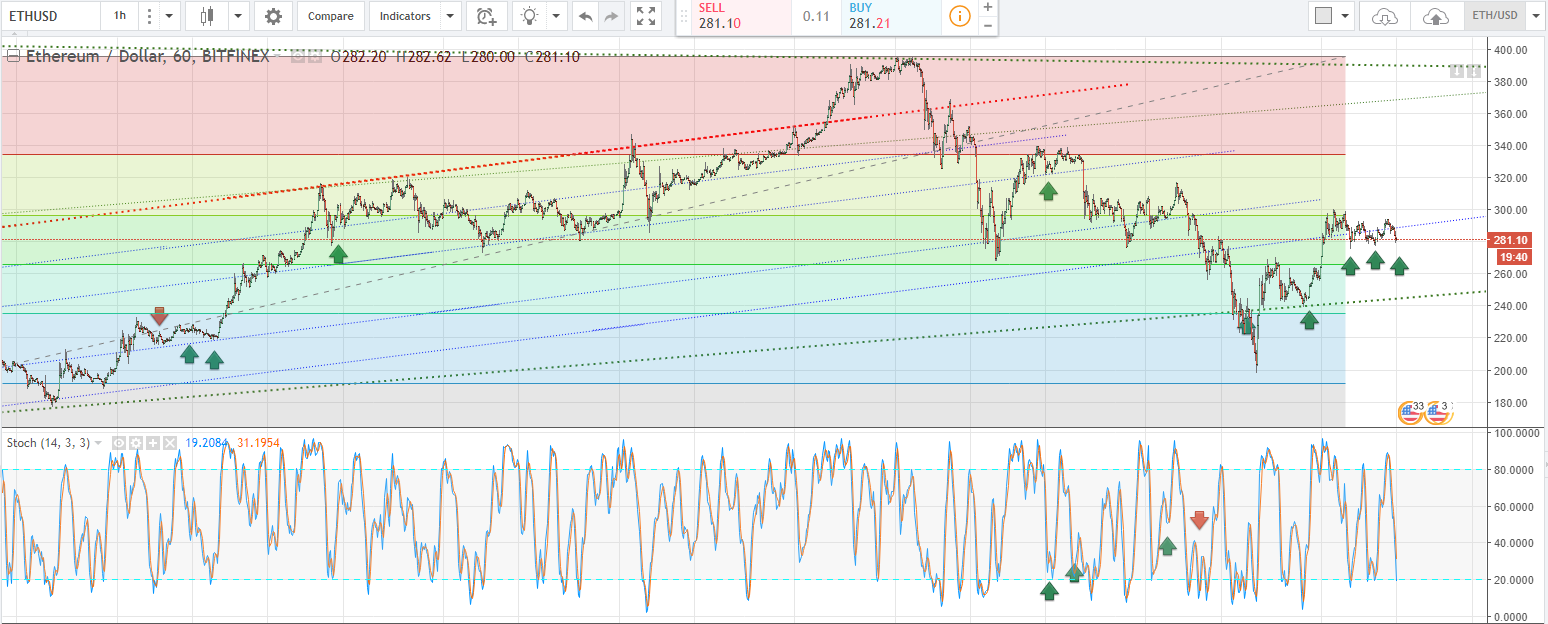
$300 for ETH has proven to be a very good resistance. As I noted a push above this ceiling should allow for a strong case for much more higher prices. The sideways pattern gives us an opportunity to spot a reset on a bullish sentiment. While the longer term charts show a bullish sentiment, it is trying to curl over into a down-trend, so the short-term chart should make its decision soon as to whether it wants to fall or break above.
Foot Note:
-RIGHT CLICK ON IMAGE AND OPEN IN ANOTHER TAB TO SEE FULL RESOLUTION-
When analyzing this chart, you will notice the Slow Stochastics indicator. I find this indicator to be the complete indicator compared to the vast majority out there. Lets explore the terms I will be using. Also use the indicator based on its respective time-frame:
Time-Frame:
1 hour - Lasts 1 hour - Few days
Daily - Last Days - Week(s)
Weekly - Last Week(s) to Month(s)
Term used:
OB - OverBought (above 80)
OS - OverSold (Below 20)
Bullish - Above 50
Bearish - Below 50
Trend - Cross up in both channel line or Cross down in both channel line.
Follow me if this has been helpful, and don't forget to give me an upvote if you feel that this article has helped in some way.