ETHEREUM.. Resistance No Surprise. Sept 21, 2017
Analysis:
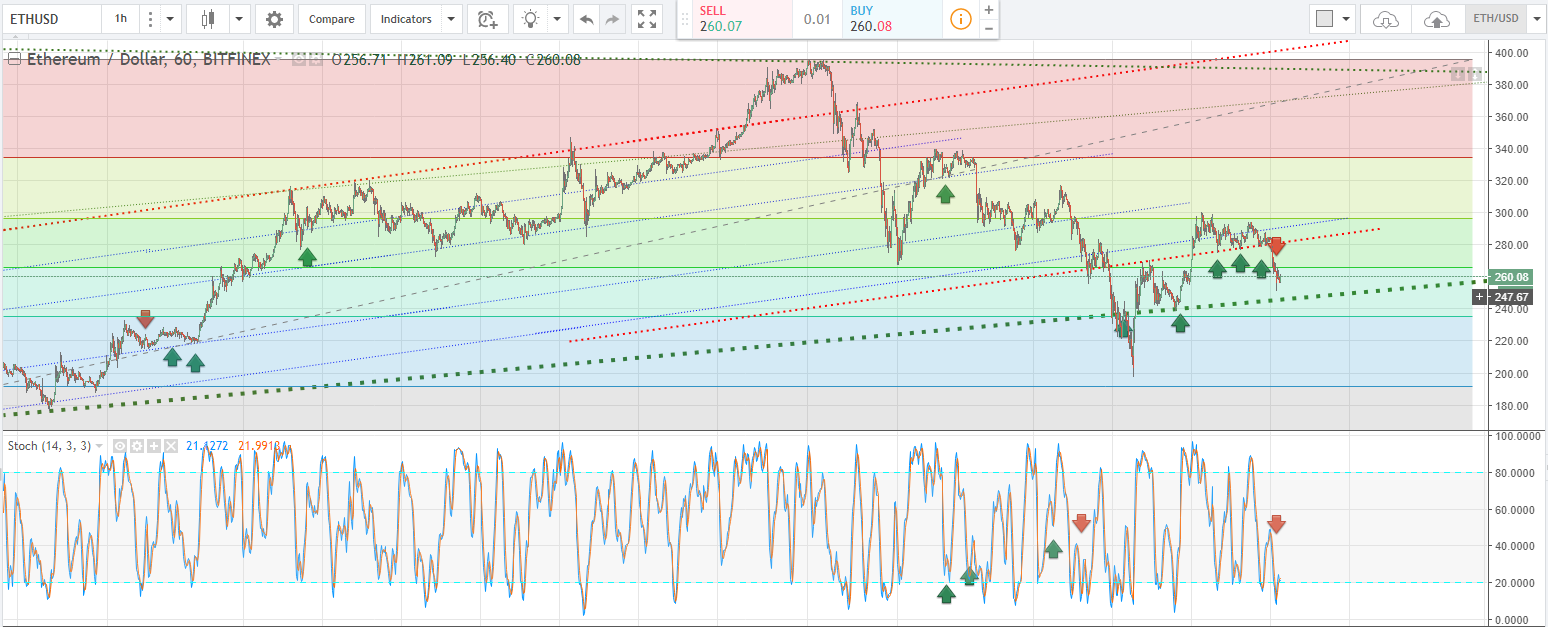
Weak signals do not make for a great move in prices of ETH. We can see the signals attempt at an uptrend but prices trended downwards at the same time. This divergence only produces negative outcomes, and the green dotted line you see below near $250 will be the major support that needs to hold. Longer-term sentiment is bearish, and at this point ETH is not tradeable unless you like to speculate.
Foot Note:
-RIGHT CLICK ON IMAGE AND OPEN IN ANOTHER TAB TO SEE FULL RESOLUTION-
When analyzing this chart, you will notice the Slow Stochastics indicator. I find this indicator to be the complete indicator compared to the vast majority out there. Lets explore the terms I will be using. Also use the indicator based on its respective time-frame:
Time-Frame:
1 hour - Lasts 1 hour - Few days
Daily - Last Days - Week(s)
Weekly - Last Week(s) to Month(s)
Term used:
OB - OverBought (above 80)
OS - OverSold (Below 20)
Bullish - Above 50
Bearish - Below 50
Trend - Cross up in both channel line or Cross down in both channel line.
Follow me if this has been helpful, and don't forget to give me an upvote if you feel that this article has helped in some way.


For you, when will it escape this ranging phase?
@andrewwu When we make the next break above $300 is what I think will lead to $380... Break that and we are off to the races.. But these lows are important accumulation point.
Congratulations @pok8rok8! You have completed some achievement on Steemit and have been rewarded with new badge(s) :
Click on any badge to view your own Board of Honor on SteemitBoard.
For more information about SteemitBoard, click here
If you no longer want to receive notifications, reply to this comment with the word
STOP