ETHEREUM.. NOT BTC, But Encouraging At This Level. Oct 13, 2017

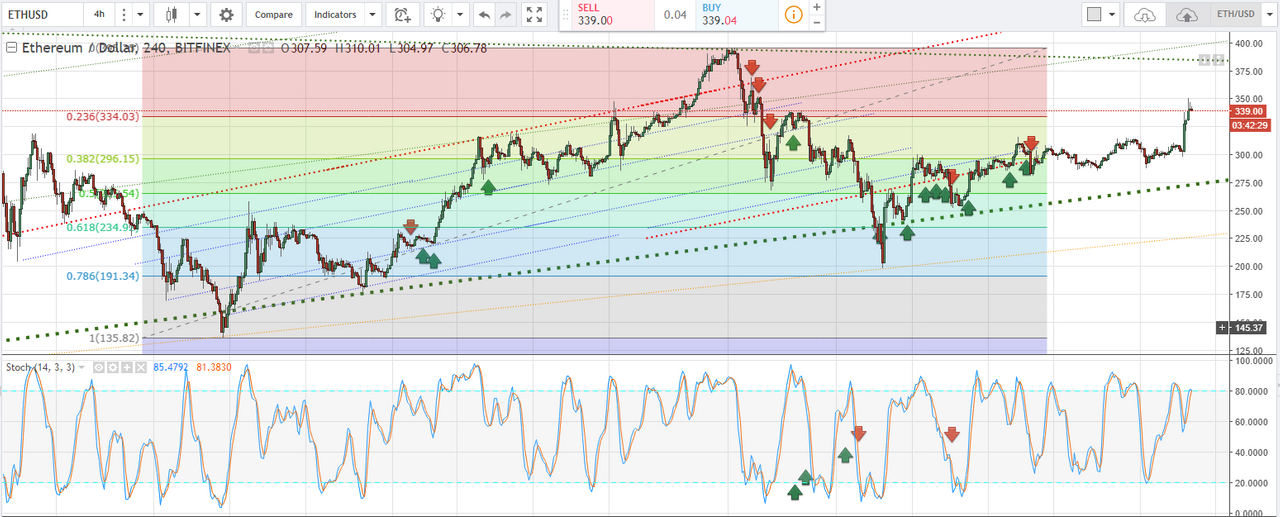
Not such a bad Friday the 13th for ETH so far. It may have not moved as much as BTC, but it is up nonetheless. The most important take from all this is that ETH has finally stayed above water for a good duration of time. Infact it has fluctuated around $300 since end of Sept. This means that most buyers and sellers have been exchanging hands within this range and have a consensus that there is value at this price level. On the technical side of things, the longer-term as mentioned before have remained bullish, and should only be traded on the upside. Judging from the signals below, you can see that the signal has also turned up therefore in SYNC with the sentiment. Price of course cannot keep going higher unless the signals are in OB situation which keeps the risk of exhuberance at a maximum. This is where we find accelerations to happen often. If we do not see signals in OB range, what I would like to see is a reset of the signal (back down) while longer-term sentiments stay bullish.
Foot Note:
-RIGHT CLICK ON IMAGE AND OPEN IN ANOTHER TAB TO SEE FULL RESOLUTION-
When analyzing this chart, you will notice the Slow Stochastics indicator. I find this indicator to be the complete indicator compared to the vast majority out there. Lets explore the terms I will be using. Also use the indicator based on its respective time-frame:
Time-Frame:
1 hour - Lasts 1 hour - Few days
Daily - Last Days - Week(s)
Weekly - Last Week(s) to Month(s)
Term used:
OB - OverBought (above 80)
OS - OverSold (Below 20)
Bullish - Above 50
Bearish - Below 50
Trend - Cross up in both channel line or Cross down in both channel line.
Follow me if this has been helpful, and don't forget to give me an upvote if you feel that this article has helped in some way.

