ETHEREUM.. Bear Control Do You Read.. Sept 22, 2017
Analysis:
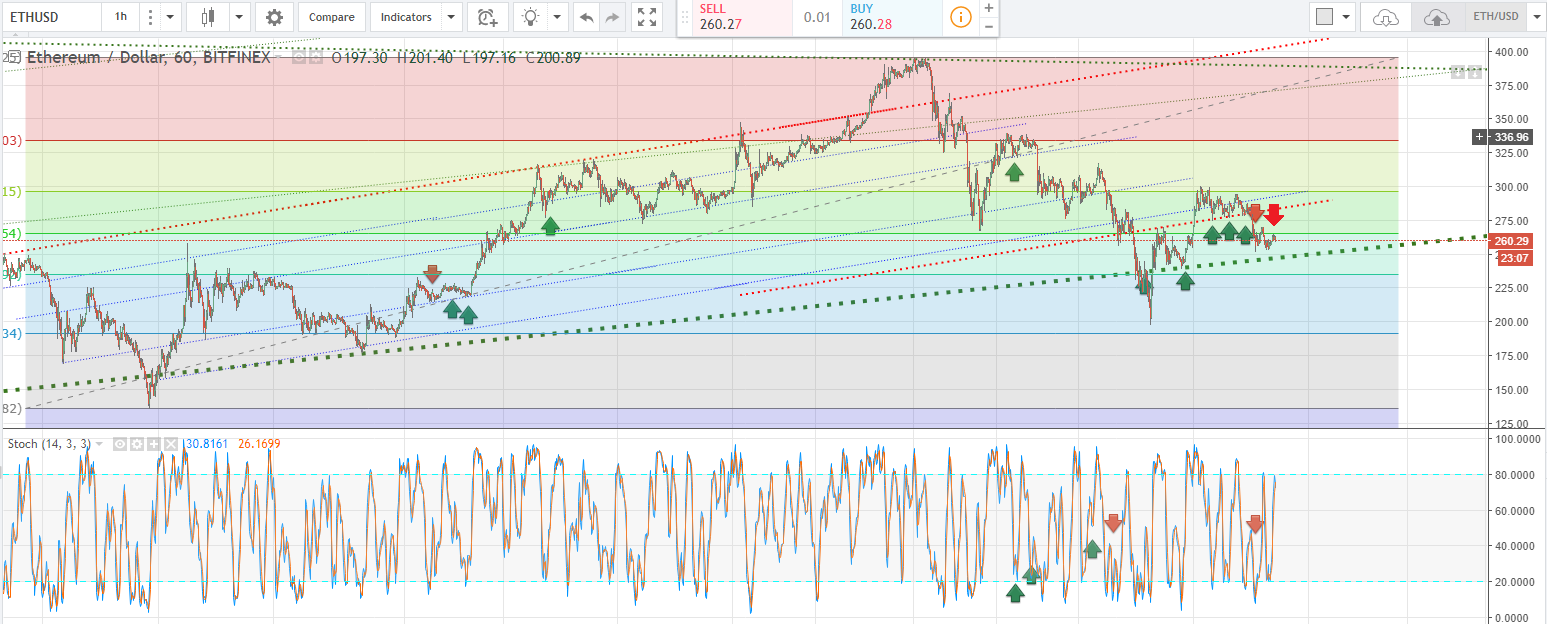
ETH signal pushed back up and prices are nowhere near making higher highs. Weak prices do not spell confidence when signals are eager to move up. Behaviour analysis of price and signals are important, and allows one to see what is happening even when no one is talking. Perhaps we finally test that Green-Dotted support line I mentioned yesterday.
Foot Note:
-RIGHT CLICK ON IMAGE AND OPEN IN ANOTHER TAB TO SEE FULL RESOLUTION-
When analyzing this chart, you will notice the Slow Stochastics indicator. I find this indicator to be the complete indicator compared to the vast majority out there. Lets explore the terms I will be using. Also use the indicator based on its respective time-frame:
Time-Frame:
1 hour - Lasts 1 hour - Few days
Daily - Last Days - Week(s)
Weekly - Last Week(s) to Month(s)
Term used:
OB - OverBought (above 80)
OS - OverSold (Below 20)
Bullish - Above 50
Bearish - Below 50
Trend - Cross up in both channel line or Cross down in both channel line.
Follow me if this has been helpful, and don't forget to give me an upvote if you feel that this article has helped in some way.