ETHEREUM.. .786% Big Bounce Sept 18, 2017
Analysis:
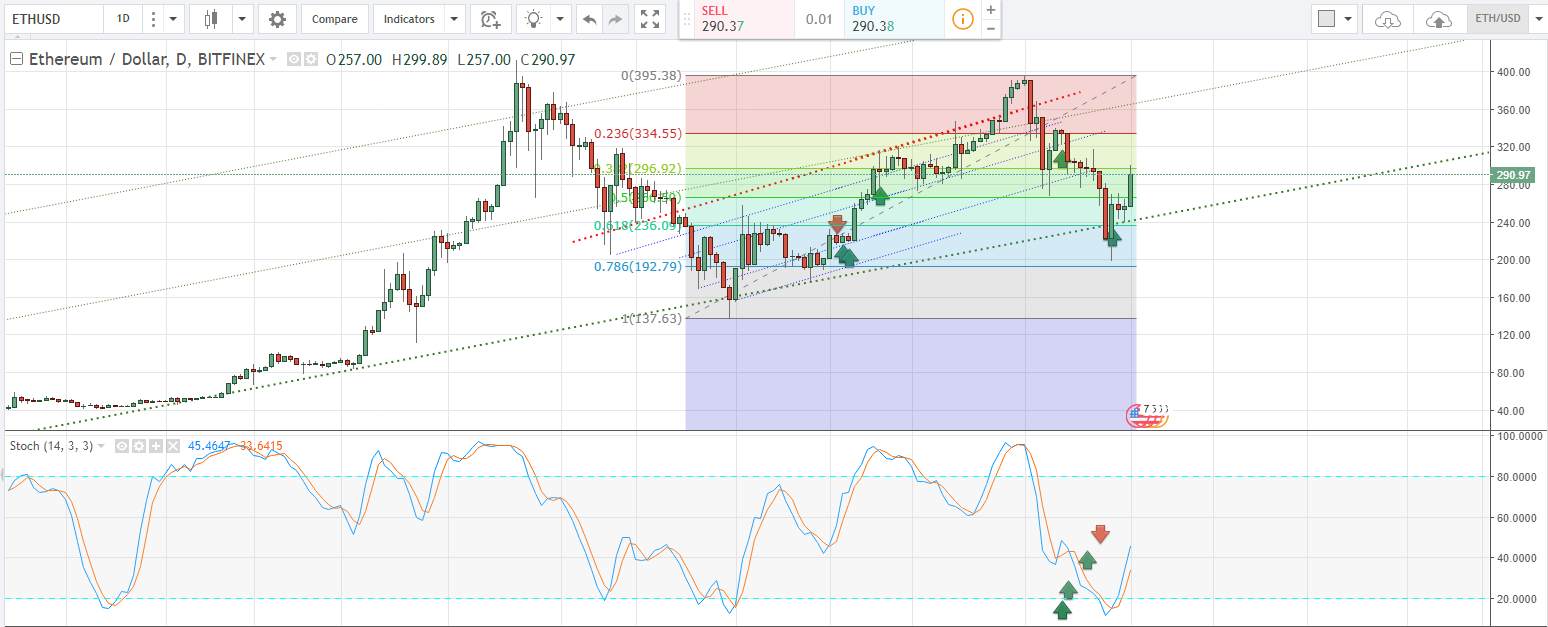
Last week we went through the importance of Fib. retracements, and importantly the .786% describing as the last line of defence before a new trend could take place. At $200 ETH bounced with good momentum. We are now re-testing the previous support turned resistance at $300 level. In Elliott Wave pattern, it seems the price moves from the beginning of Sept. to present day has been a corrective move. While a corrective move suggest that a price move higher or all time high should manifest, the corrective move could still stagnate sideways until a breakout can be had. So the best way to watch is to be aware of the signal and where its at.
Foot Note:
-RIGHT CLICK ON IMAGE AND OPEN IN ANOTHER TAB TO SEE FULL RESOLUTION-
When analyzing this chart, you will notice the Slow Stochastics indicator. I find this indicator to be the complete indicator compared to the vast majority out there. Lets explore the terms I will be using. Also use the indicator based on its respective time-frame:
Time-Frame:
1 hour - Lasts 1 hour - Few days
Daily - Last Days - Week(s)
Weekly - Last Week(s) to Month(s)
Term used:
OB - OverBought (above 80)
OS - OverSold (Below 20)
Bullish - Above 50
Bearish - Below 50
Trend - Cross up in both channel line or Cross down in both channel line.
Follow me if this has been helpful, and don't forget to give me an upvote if you feel that this article has helped in some way.