$ETC/BTC Poloniex Technical Analysis Jan. 03, 2017.
Hello Steemers!

Doing an Ethereum Classic ($ETC) chart today.
Currently ranked 6th on coinmarketcap.
Fore more info about Ethereum Classic check out their website and their Bitcointalk thread:
Website - https://ethereumclassic.github.io/
BCT thread - https://bitcointalk.org/index.php?topic=1559630.0
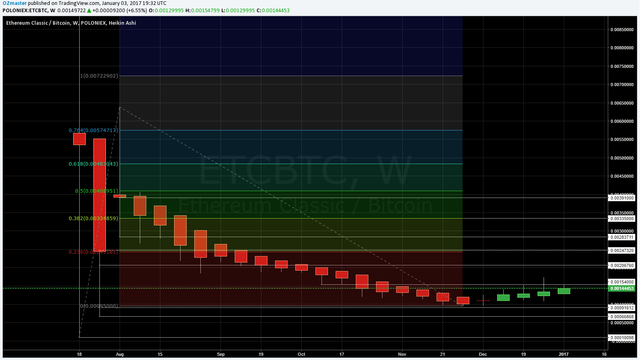
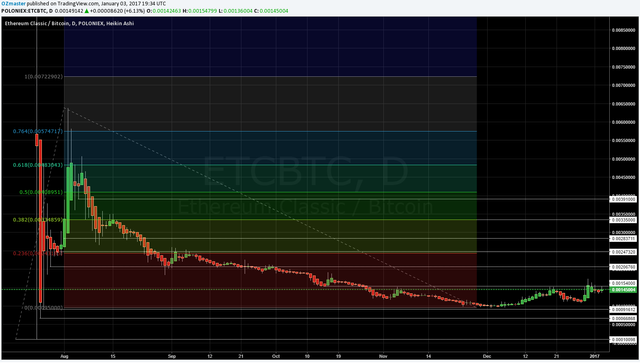
Starting with the weekly charts as usual. Will be showing the daily and the weekly.
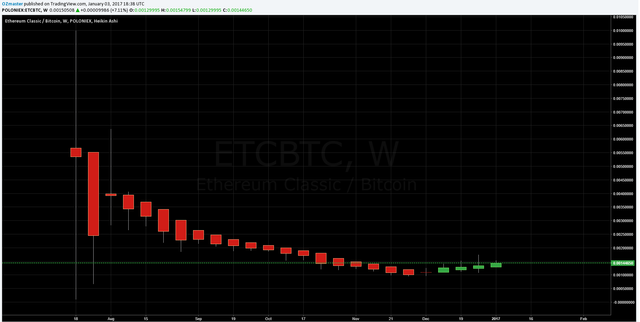
weekly chart Poloniex - clean -Jan. 03, 2017
On the weekly we can see how ETC had a very volatile early trading, settling at around 0.004 BTC and entering a downtrend which seems to have bottomed at around 0.001 BTC.
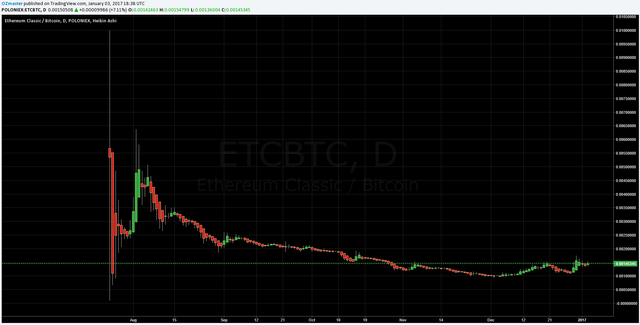
daily chart Poloniex - clean - Jan. 03, 2017
Once on the daily, it is visible how the price marked a all time low as low as 10k satoshi and a local high which I took as a "all time high" on 0.0064 BTC. Since hitting the 0.0064 point it entered a downtrend bottoming at 0.00095 BTC.
Since it hit the 0.00095 levels it started turning upwards, at the moment being traded at around 0.00145 BTC.
Pulling lines on the daily.
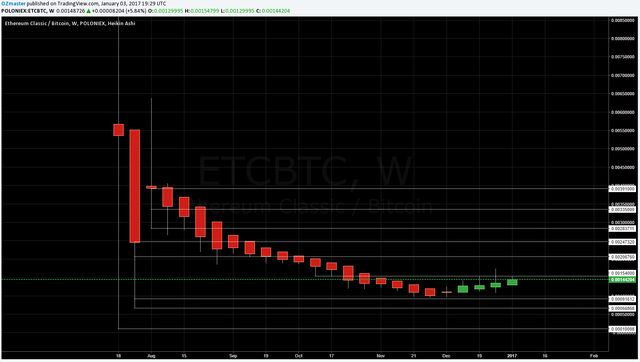
weekly chart Poloniex - lines - Jan. 03, 2017
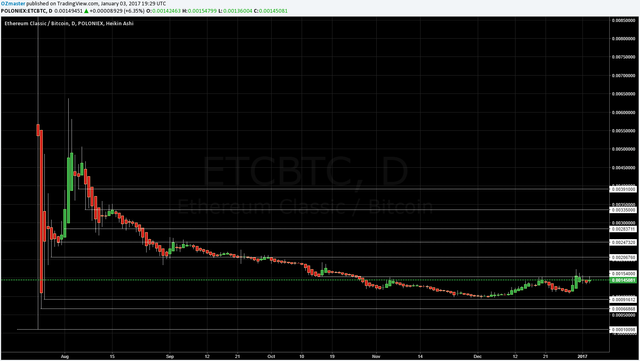
daily chart Poloniex - lines - Jan. 03, 2017
With the lines on we can see a major accumulation zone between the local low of 0.00095 and the 0.00155 BTC level where the price is being contained.
Up next is the ~0.002 BTC line which seems to be marking yet another resistance level which the price seems to be entering in
case it keeps it's uptrend.
Pulled a fib from the all time low to the 0.0064 local high.
weekly chart Poloniex - fib - Jan. 03, 2017
With the fib on we can see a major accumulation zone all the way up to about 0.0025 BTC.
Above it the 0.00335 level seem to play another important level before reaching into the higher price levels.
daily chart Poloniex - fib - Jan. 03, 2017
On the daily we can see how the bottom accumulation level seems to be split in a couple levels, first one topping at around 0.00155 BTC, and the second one at arou 0.002 BTC.
The second fib zone looks like it's divided into 2 levels, first one from around 0.0025 to about 0.00285 BTC, and the 2nd, from 0.00285 to the top at around 0.00335 BTC.
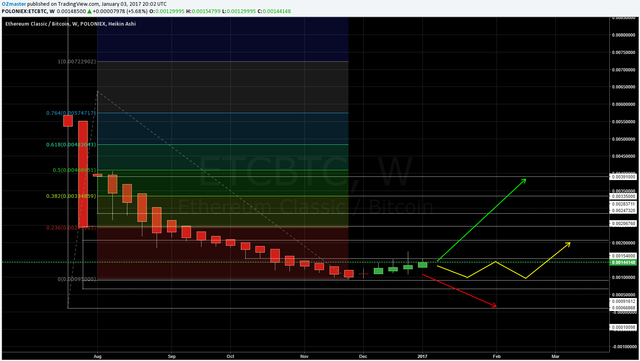
What to expect?
1st (green) - The price marked a new bottom and entered a strong uptrend wwith a possible target of 0.00391 BTC.
2nd (yellow) - The price enters an accumulation period between the newly made local low of ~0.00095 and the ~0.00154 BTC line before it enters the next level of the lowest fib zone
3rd (red) - The price drops lower seeking new local lows, with possible targets at around 0.000665 BTC and even as low as the all time low at around 10k satoshi.
COMMENT
Once again, I will post the comment by commenting as it involves my personal opinion!
Thank you for understanding!
If anyone has any questions or need's help fell free to ask, I will try to explain as fast and as best as I can.
Critics, comments, reply's, counters, advice's, etc. are always welcome!
Have my charts helped you in any way?Let me know with a comment below :)
Are there more people who are doing TA?
Please post the links to your TA's posts into the comments as well!
DISCLAIMER
I am showing multiple scenarios on the price movement, in the post itself I do not take any stance, either bullish or bearish. I am not responsible for neither you’re winning nor you're losses upon trading! the "comment" section is my personal opinion and does not mean I have to or do hold any positions in the given market.
Everyone who uses TA develops his own unique charting style, please keep that in mind.
Kind Regards, OZ :)
COMMENT
Expecting the price to follow the uptrend it recently started and looking at a possible target at around 0.0039 BTC.
I also think there will be nice volume on ETC with plenty of opportunities for daytrading.
This post has been ranked within the top 25 most undervalued posts in the second half of Jan 03. We estimate that this post is undervalued by $16.74 as compared to a scenario in which every voter had an equal say.
See the full rankings and details in The Daily Tribune: Jan 03 - Part II. You can also read about some of our methodology, data analysis and technical details in our initial post.
If you are the author and would prefer not to receive these comments, simply reply "Stop" to this comment.