Review prices Ethereum for the week — ETH/USD
ETH / USD retraced below the level of the 430, but there is strong support above the $408.
— a few days ago ETH is headed for resistance at $495-500, where there sellers;
— there is a bullish trend with strong support at $408 for 4-tion chart ETH / USD;
if buyers will not be enough, the pair may continue downward movement, but there is support near $418 and $408.
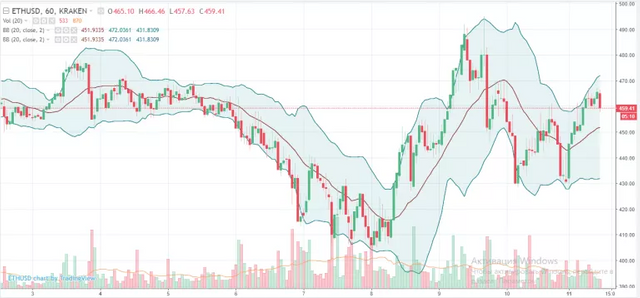
Last week, above $400, was dominated by strong price fluctuations. The Ethereum several times checked $400 and then consolidated for a while. Once the consolidation is over, the price has risen sharply above $480. The price moved to $500, before faced with sellers. The maximum was $497,71, where he began a corrective wave.
ETH has passed below the 50% Fibonacci from $397,30 to $497,71. The price may continue to decline to $428-428. On 4-hour chart ETH / USD has a bullish trend with support at $408. Intermediate support — to 76.4% Fibonacci from $397,30 to $497,71 $421.
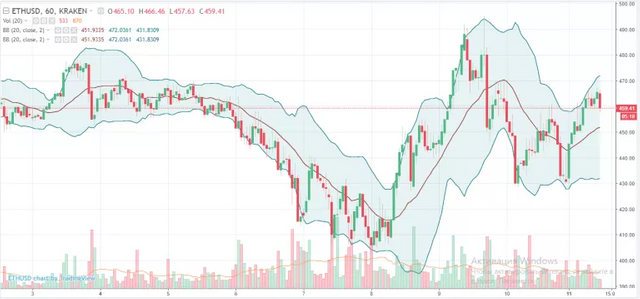
There are many lines of support above the level of $408, which will prevent further decline. The current trend is still positive, the recent decline can be seen as a correction from $497. While price is over $400, it can resume its uptrend and go to the level above $460-465.
4 hour MACD — moves from bullish to bearish.
4 hour RSI is below 50 level.
Support — $408
Resistance — $465
Share your opinion about this news in the comments.