The week of Ethereum and Ripple
Price increases by the bank. The clear winner: Ripple. But for Ethereum investors, too, the last few days have been anything but bad. The analyses were good for 73 and 50 percent performance.
BTC (BTC/USD)
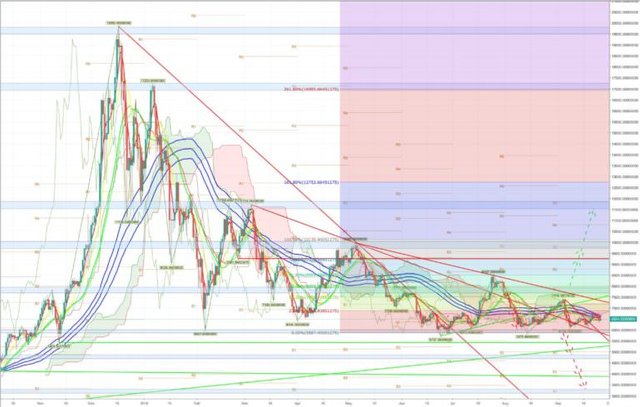
Wacker holds Bitcoin. After a significant rise to 6,800 US dollars, the correction is currently underway. With the upward movement the Bitcoin came into the cloud of the Ichimoku-Kinko-Hyo-Indicator. For the time being, things did not go any further here. The trend-setting impulses are still missing. The US$ 6,000 mark is still holding. A sideways movement invites you to trade, but does not trigger large buy or sell signals. The sell signal of the moving averages has now been cancelled. The short-term downtrend was overcome.
Bullish variant:
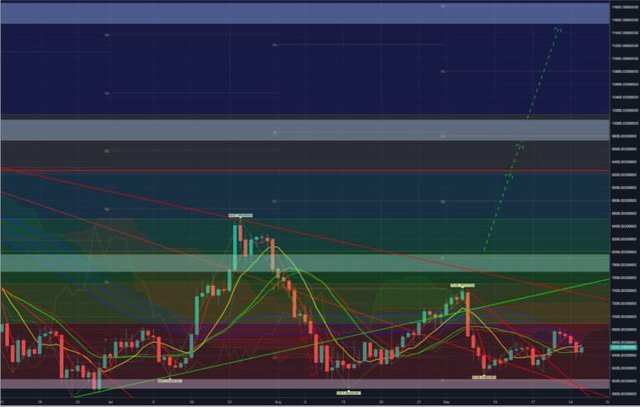
The price continues to rise and price losses below 5,877 US dollars do not occur. A short-term bottom was already found at 6,300 US dollars. A price increase over 6.800 US Dollar reaches the lower edge of the Ichimoku-Kinko-Hyo-Indicator. The cloud is only broken through with prices above 7,200 US dollars. On the way to the buy signal at 8,000 US dollars, multiple resistances have to be taken. Only then is the way clear for the following targets: 9.261 US Dollar, 9,726 US dollars and 11,540 US dollars.
Bearish variant:
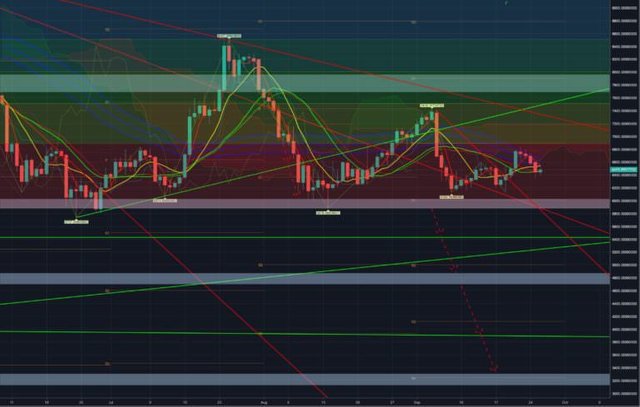
The lower cloud edge of the Ichimoku-Kinko-Hyo-Indicator sets the direction. The weakness of the Bitcoin continues. The opportunity to use the US$ 6,000 mark as a springboard was not seized. The US$6,000 mark is being tested. After this cannot be held, the 5,877 US Dollar is undercut and the target rate of 5,428 US Dollar is activated. A relapse below this level leads to exchange rate losses of 4,872 US dollars. A "sell-off" carries the risk of making a bottom possible only at USD 3,300.
Ethereum (ETH/USD)
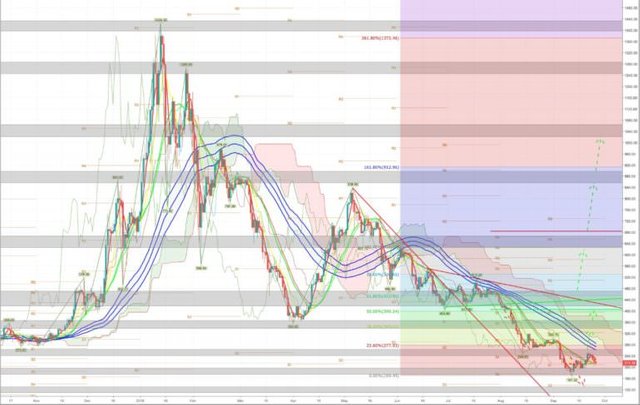
Ethereum is at the top with 50 percent price gain if you have followed the ongoing analysis. A nice example of how you can earn good money with trading conditions.
After Ethereum narrowly missed the sell signal, the long setup came into play. The further condition from the "bullish variant" was not fulfilled:
"A rise above 263 US dollars completes the short-term bottom formation.
The high was generated at 255 US dollars. Thus one had to look for an exit here. Likewise, it is still too early to speak of a medium-term bottoming out. This would have been more mature if Ethereum had fulfilled the condition mentioned. The moving averages signal a sideways trend. The cloud of the Ichimoku-Kinko-Hyo-indicator continues to build up.
Bullish variant:
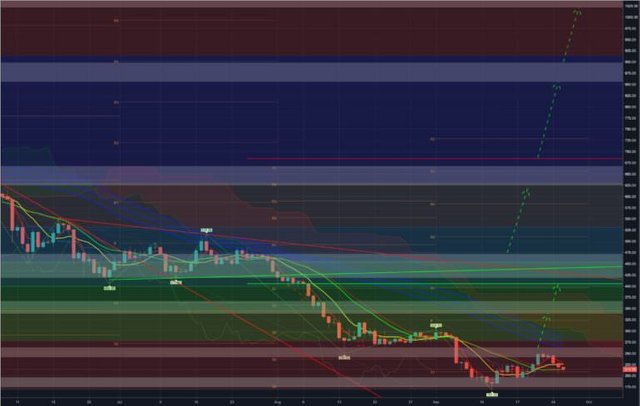
Ethereum ends the short-term correction that has been heralded since USD 255. The 167 US Dollar can still be held. The course goes over 255 and 263 US Dollar. Above this, the 338 US dollars are capitalized. The moving averages also generate a buy signal. The upper cloud edge of the Ichimoku-Kinko-Hyo-indicator is already exceeded with prices above 325 US dollars. A breakout above 366 US dollars releases the 405 US dollars. The big buy signal is only generated with rates above 471 US dollars. The next target will then be 624 US dollars.
Bearish variant:
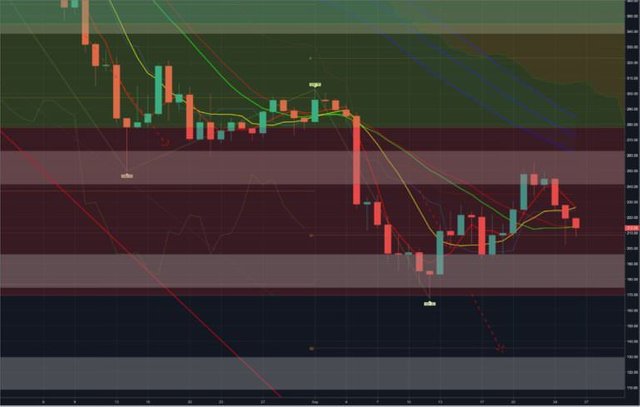
The unused buy-signal has an increasingly negative effect on the supposed bottom formation. There is no further high above 255 US dollars. The movement low at 167 US dollars is undercut. The Ethereum price continues to crumble and the price target for the short scenario of 129 US dollars is set.
Ripple (XRP/USD)
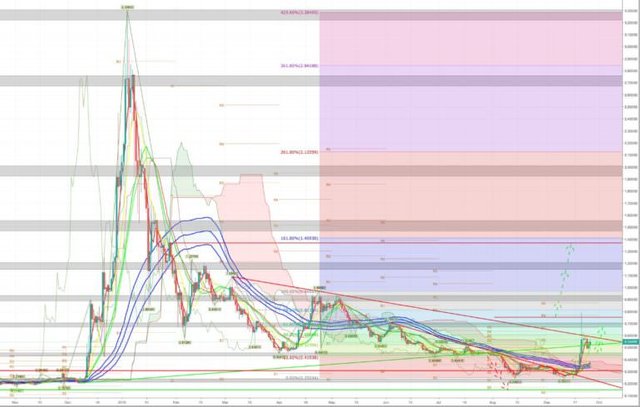
Ripple has cleared everything on the upper side for the time being. Faithful readers were able to take 73 percent price gains with the bullish version. Nevertheless, a false signal was generated. Due to the high volatility, the 0.75 US dollar was exceeded. This signaled a further upward price target of 0.89 US dollars. In fact, however, at 0.75 US dollars only just under 6 % price gains were achieved. The upward movement already ended at 0.79 US dollars and the price target was therefore missed. The fact that it was not put out to tender in the last update does not change this. Fortunately, however, on September 25th another entry into Ripple was offered. The presented range around the US$ 0.44 mark was restarted and maintained. With this, another 30 percent profit was recorded. The accompanying indicators are still bullish.
Bullish variant:
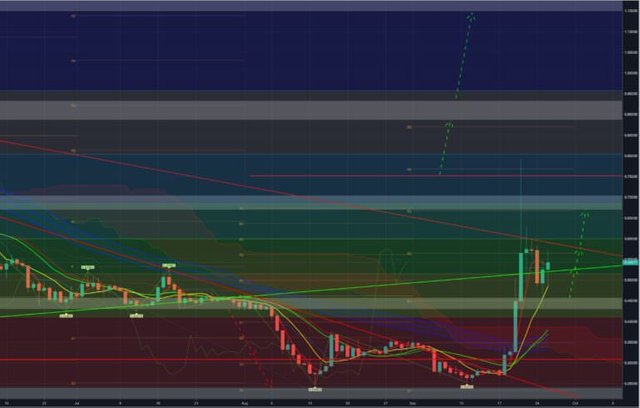
The 0.44 US dollar mark has now been successfully tested and Ripple is now ending the short-term correction. The downward trend can be overcome sustainably. This is currently running at 0.58 US dollars - with a downward trend. So far, no daily closing price could take place.
The superior buy signal is still active above 0.75 US dollars. The price targets are then: 0.89 US dollar, 1.15 US dollar and 1.37 US dollar.
Bearish variant:
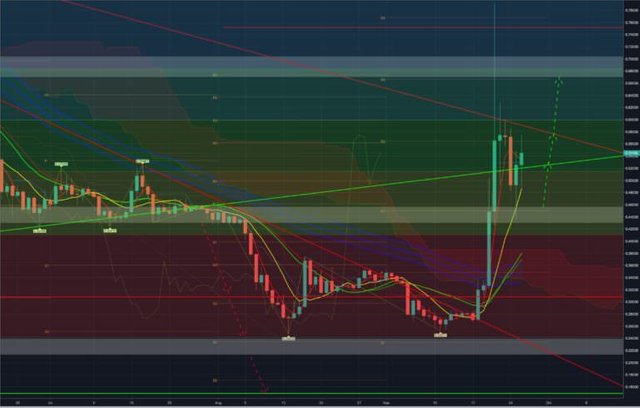
The "run" at Ripple is over. The downtrend could not be overcome by the end of the day and this fact is motivating more and more investors to sell. Price losses below 0.43 US dollars point to initial weaknesses. The upper cloud edge of the Ichimoku-Kinko-Hyo-Indicator is currently running at 0.36 US Dollar - falling tendency - and provides for a short-term stabilization. The 0.24 US dollar mark can no longer prevent a further correction. If the ongoing correction above 0.21 US dollars does not come to an end, the 0.15 US dollars are on the horizon.
Conclusion:
We see a very nice rise in various crypto currencies. Even if these have now changed over to the correction at short notice, one could still cut some out of the movement. Of course, the most interesting one at the moment is the Ripple movement. In particular with this it remains to wait now whether it concerns a straw fire or a large soil was found.
Disclaimer: The price estimates presented on this page are not recommendations to buy or sell. They are merely an analyst's assessment.
Pictures based on data from bittrex.com and bitfinex.com taken at 14:00 on 26 September. USD/EUR exchange rate at editorial deadline: 0.86 Euro. All extracted from btc-echo here (https://www.btc-echo.de/bitcoin-ethereum-und-ripple-kursanalyse-kw39-die-woche-von-ethereum-und-ripple/).