SEC investigates Ethereum status, Ethereum ETF may be rejected.
After the SEC approved the Bitcoin ETF in January 2024, one of the crypto news that became public discussion was the Ethereum ETF. According to news circulating currently, the SEC is conducting an investigation into the Ethereum Foundation by summoning companies to investigate documents and financial records related to their transactions with the Ethereum Foundation.
The results of this investigation will later become a reference for decision-making on Ethereum ETF approval. The SEC's investigation into Ethereum comes as BlackRock, Fidelity, and six others await the regulator's decision regarding their applications for spot Ethereum ETFs (exchange-traded funds).
However, it seems that some analysts are skeptical about the approval of the Ethereum ETF, which has a deadline of May 11. Bloomberg ETF analyst Eric Balchunas said there is now only a 25% chance that the SEC will give the green light to the spot ETH ETF.
Ethereum/USD Technical analysis today
Ethereum price at the time of writing at $3,490.38 is slightly down 1.09% with a daily range of Low $3,412.22 and High $3,586.90.
The indicator technical summary and hourly moving average by Investing currently give a Neutral signal. In this summary, the technical indicator gives a strong sell signal, while the moving average gives a buy signal.
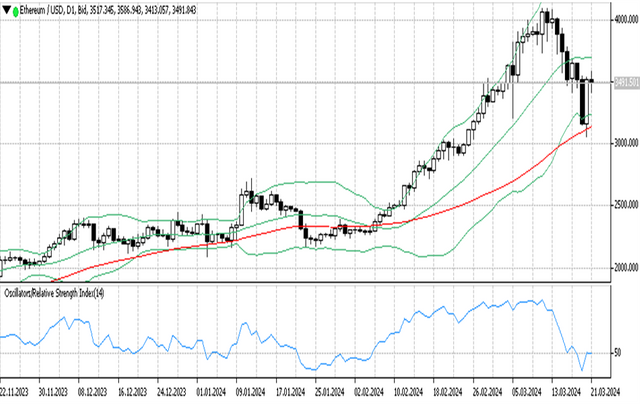
On Ticktrader the price of Ethereum moves below the middle band line. In the daily timeframe, the price forms a Doji candle which reflects market doubts, this is an indecision candle.
Bollinger bands appear to be starting to form a flat channel, an indication that market consolidation is taking place. The distance between the upper and lower bands is still wide, an indication of high market volatility.
The 50 MA below the price forms an upward channel indicating bullish sentiment. MA 50 line could be dynamic support in this case.
The RSI indicator shows level 50 which means the price is in the neutral zone.
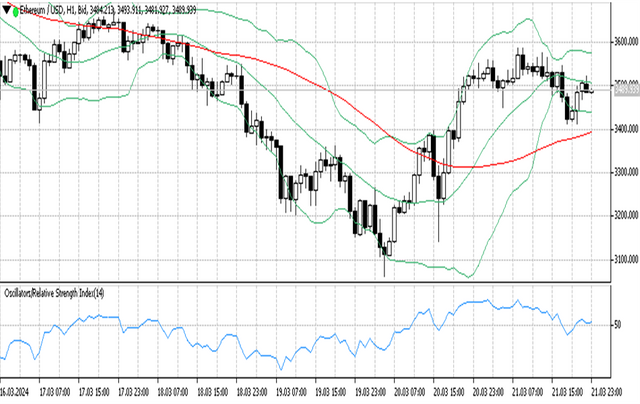
In H1 timeframe, we see the price moving near the middle band line which is the price pivot point in this timeframe. Prices appear to be consolidating in this area.
Bollinger bands here form a flat channel with narrowing bands indicating reduced market volatility.
The 50 MA below the lower band line forms a slight upward channel indicating weak bullish sentiment.
The RSI indicator shows level 52, which means the price is 2 points above the uptrend level.
Support and resistance
S3: 3434.14
S2: 3458.57
S1: 3471.02
PP: 3495.45
R1: 3507.9
R2: 3532.33
R3: 3544.78