Ethereum Crashed Then Bounced! What Will Happen Next? Buy This Dip Or Stay Away? Technical Analysis 05 27 2017.

So ETH dropped like a bag of rocks in the last 3 days and hit a low of $110 this morning on Bitfinex exchange. All those people who didn't get to buy around the highs of $200 and wished they could get in had a great chance to buy at 50%+ off. When I was posting the below chart this morning I saw the price hit $110. By the time I logged in to my account ETH was already at $135 but I bought some anyways.
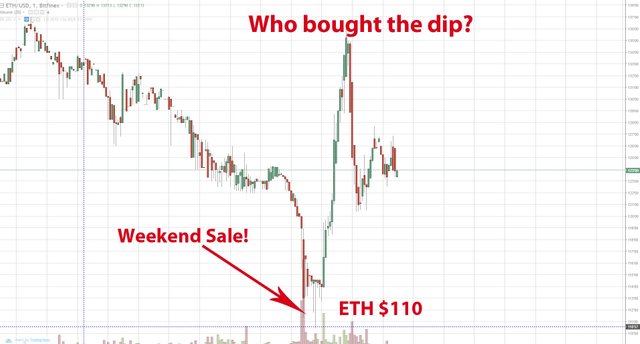
So who bought this dip today? It was a huge Memorial Day long weekend sale (for USA). I found this dump very suspect! Who decided to sell so many ETHs 5am on a Saturday morning of a long weekend holiday when everyone is away on mini vacations? But let's stick to technical for now.
The above chart is an ETH 1 minute chart, as you can see for about 20 minutes, heavy sell volumes and pushed price all the way down to $110 and the sellings all the sudden stopped and buying started. Someone bought non-stop for 20 minutes and pushed ETH all the way up to near $140 level.

Two days ago I pointed out ETH was over bought signaling from the Bollinger Bands, and it most likely will sell off and consolidate sideways like it did couple weeks ago. Well, it happened. ETH sold off and the price got push all the way down to the 20 Day Moving Average line just like it did back on May 17th and then bounced right off the 20 DMA. Will ETH do it again and bounces off $110 to stop the bleeding? Let's look at the Fibonacci retracement below for further confirmation.
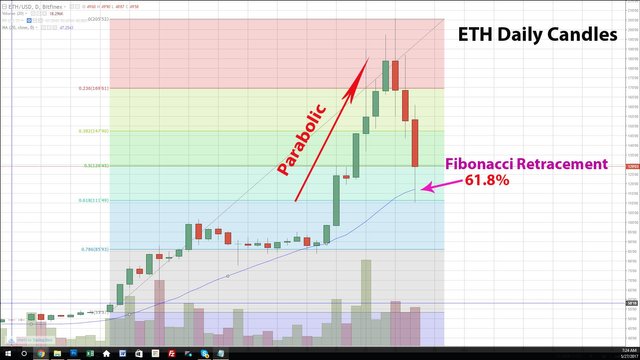
As you can see, ETH went parabolic for 8 days and the price more than doubled. That is very unusual for any investment or currency. In most cases, parabolic moves result in 61.8% Fibonacci retracement as active traders would sell to take massive profits from the up move. And the chart above showed ETH hit the 61.8% Fib retracement support and bounced right off from there. There is no guaranteed price will stabilize but most of the times selling usually slows down once it reaches that level.
So should we buy in now because all these indicators are signaling the selling are most likely stopped? Let's see what the latest daily candle chart is telling us below.
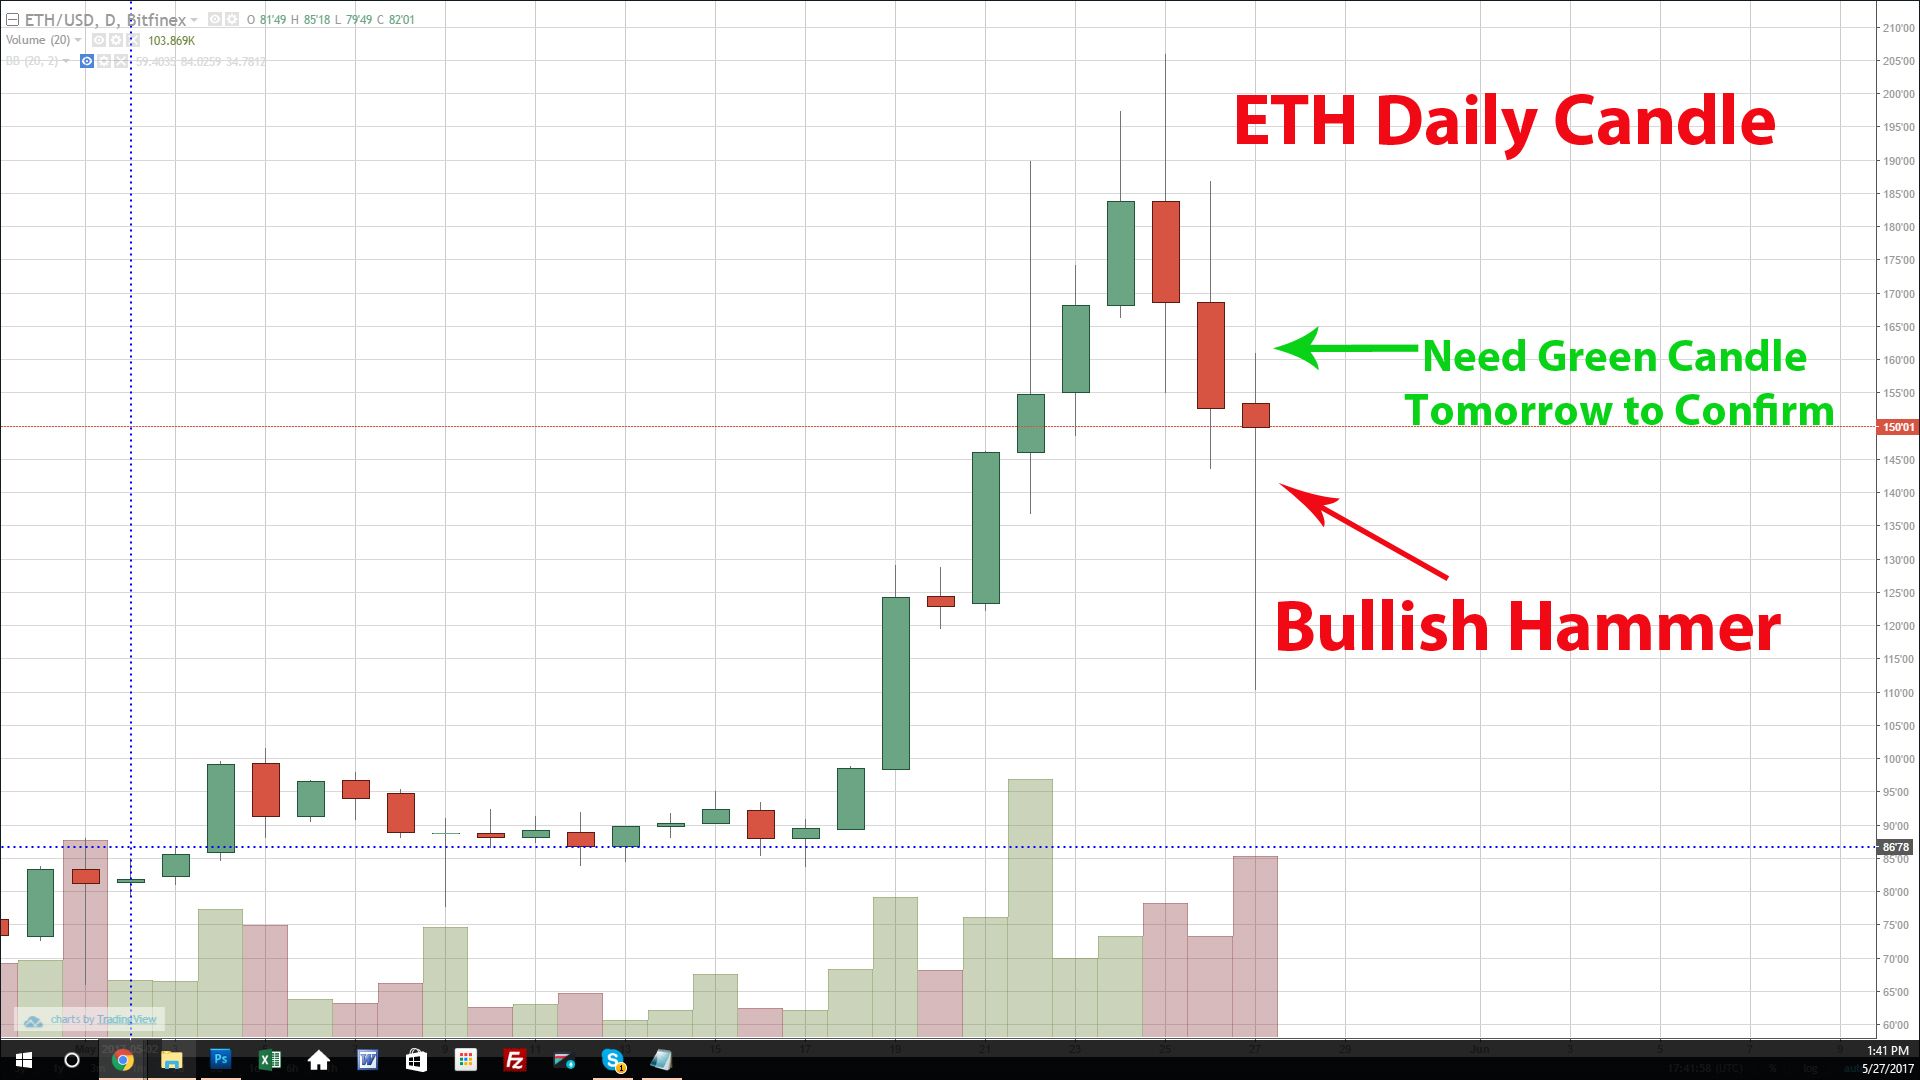
The latest candle chart is showing a strong bullish hammer right at the support. If ETH can finish today looking like that or that red hammer turns green, it will be a very bullish sign signaling the selling most likely are over. But in order to be sure, traders usually would wait for the next day's price showing a long green candle to confirm the move before buying.
For those people who were panicking this morning, here are some facts that might help ease your mine....
- ETH is now trading at $164 at Coinbase and only down $13.51 from yesterday (24 hour time frame)
- ETH is up $38.17 from last Saturday
- ETH is up $103 from a month ago
The drop this morning seem so scary because ETH was up from $86 to $205 in just 8 days then sold off the last 3 days. Just ask yourself this question: If you were one of those traders who bought it at $85 10 days ago, would you sell some at $200 to double your profits?
Please follow me on Facebook https://www.facebook.com/CryptoEverything/
Feel free to send me a message there if you have any questions or comments!
Have a wonderful weekend & Happy trading!
Please resteem, upvote & follow!
Jia H
Awesome analysis! Thanks a lot!
Thanks!
Good points in this blog. Thanks for bringing this to my attention. Buy low, sell high, it seems so simple but most investors still don't seem to get it :-) An interesting website I found: https://www.coincheckup.com They give great insights in the team, the product, advisors, community, the business and the business model and other techincal insights. On: https://www.coincheckup.com/coins/Ethereum#analysis To check Ethereum Investment and research analysis.