ETHBTC market overview 16 -> 25 Feb: Elliott Waves and Support Levels.
All right, folks.
The impulse pattern, posted on 16th of February seems to be broken:
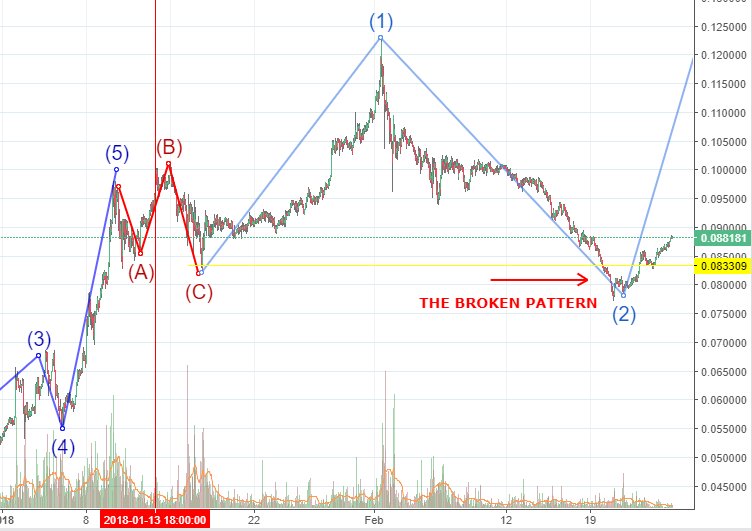
The price fell 3% below the yellow line. Can it be the reason to change the count? Here is the alteranative:
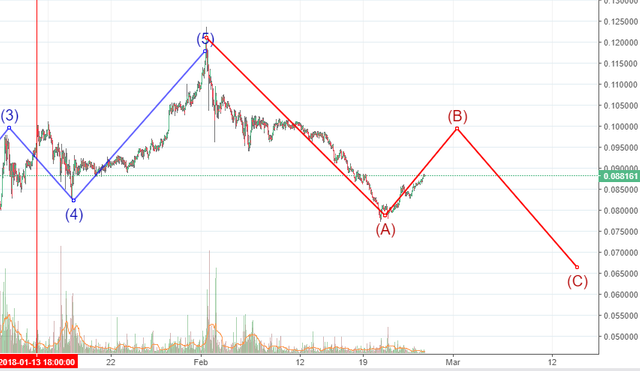
The level of 0.1BTC is the breaking point for me once more. If we are in the A-B-C now, the bounce is expected there. If the pattern of the impulse is not broken, but that is just another cryptotrick - we can go on with the wave 3.
I keep the neutral position on that pair at the moment.
And as always, some stats from coinmarketcap.com:
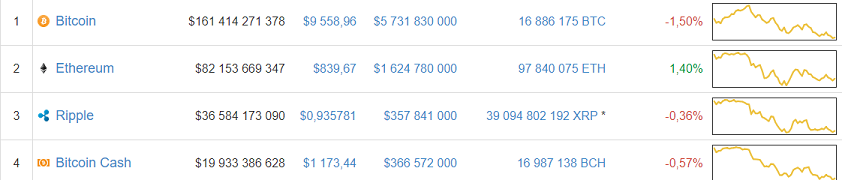
Feb-25-2018
BTC: $161B / 38.0%
ETH $82B / 19.35%/
Feb-16-2018
BTC: $171B / 35.4%
ETH $92B / 19.04%
Feb-12-2018
BTC: $148.5B / 34.4%
ETH: $85.2B / 19.73%
Feb-7-2018
BTC: $139B / 35.7%
ETH: $80B / 20.5%
Jan-31-2018
BTC: $170B / 33.6%
ETH: $107B / 21.1%
BTC dominance is growing. ETH is on the second place with the half of BTC total capitalization or 19.35% of the total cryptomarket cap.
Stay tuned
This post has received a 1.81 % upvote from @boomerang thanks to: @dkn