Experimental Analysis Indicates Huge Move for Ethereum (ETH)!
#Ethereum is setting up for a massive move, which may make it the number-one #altcoin to #HODL in 2018!
I've been working on a new experimental analysis method, which I'd like to share below:
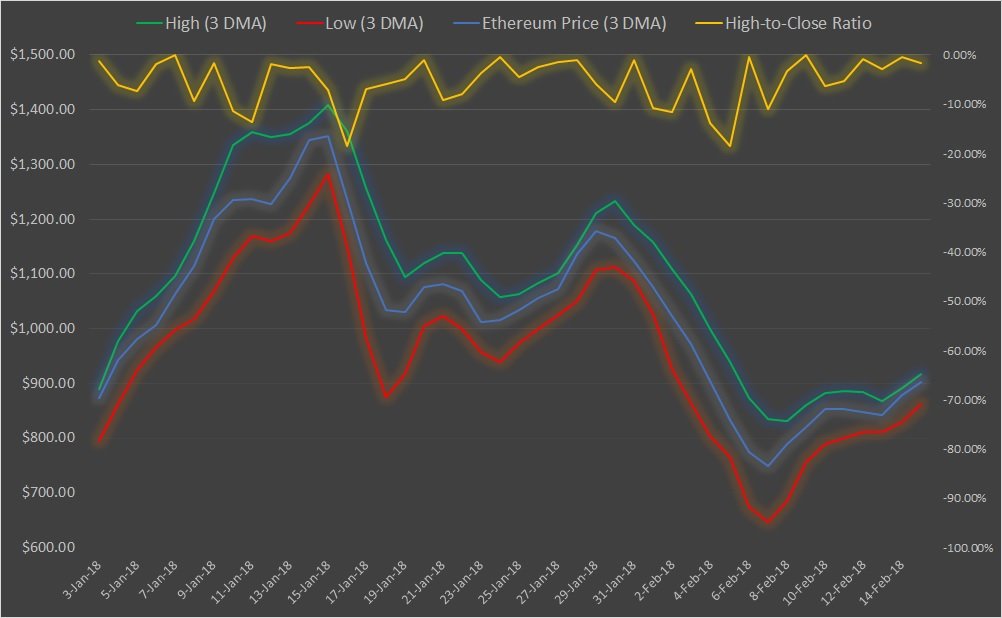
We have a lot of moving parts here, so let me explain. The primary axis is the Ethereum price chart, sandwiched between two lines -- the green line represents the highs of the session, and the red line represents the low. For readability ease, I used a three day moving average (DMA).
The yellow line above is actually on the secondary axis, which I call the "High-to-Close Ratio." If the Ethereum "closing" price is also the same as the highs of the 24-hour session, the HCR is 0%. If there is a huge gap between the close and the session highs, it would register as a negative percentage.
Major Bullish Sign in the Ethereum Price
Unlike the first few weeks of 2018, there was a contradiction between the rising price point, and a declining HCR (negative trading sentiment relative to session highs). Sure enough, the rally eventually petered out, and the price dropped to multi-month lows!
This time around, as the price rises, so too does the HCR -- above -10%, and in many cases at, or very close to 0%. This indicates that the rising price confirms bullish sentiment towards Ethereum.
I think Ethereum will have a monster year in 2018, perhaps $3,000 by the end of 2018/beginning of 2019.
I'm planning to hold until it hits at least $5000 before I sell part of my stash. But regardless, $3000 sounds nice.