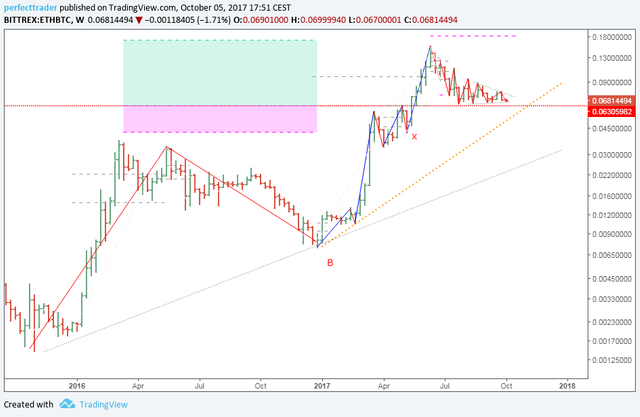
ETH/BTC ETHEREUM Technical Analysis
The following chart shows Ethereum compared to Bitcoin on a weekly basis. It is impossible to classify the movement since 02.11.2015 as impulsive wave. It is much more likely that a complex correction movement will take place here. This structure still has the potential for higher prices. Especially if the support 0.063 remains untouched, a dynamic upward wave to 0.176 is very likely.
If the Ethereum falls below 0.063, a movement towards 0.041 must be taken into account.
ETH/BTC Ethereum weekly chart

follow us https://twitter.com/perfecttrader