ETH Technical Analysis - Bearish Trading As Key Support Levels Broken
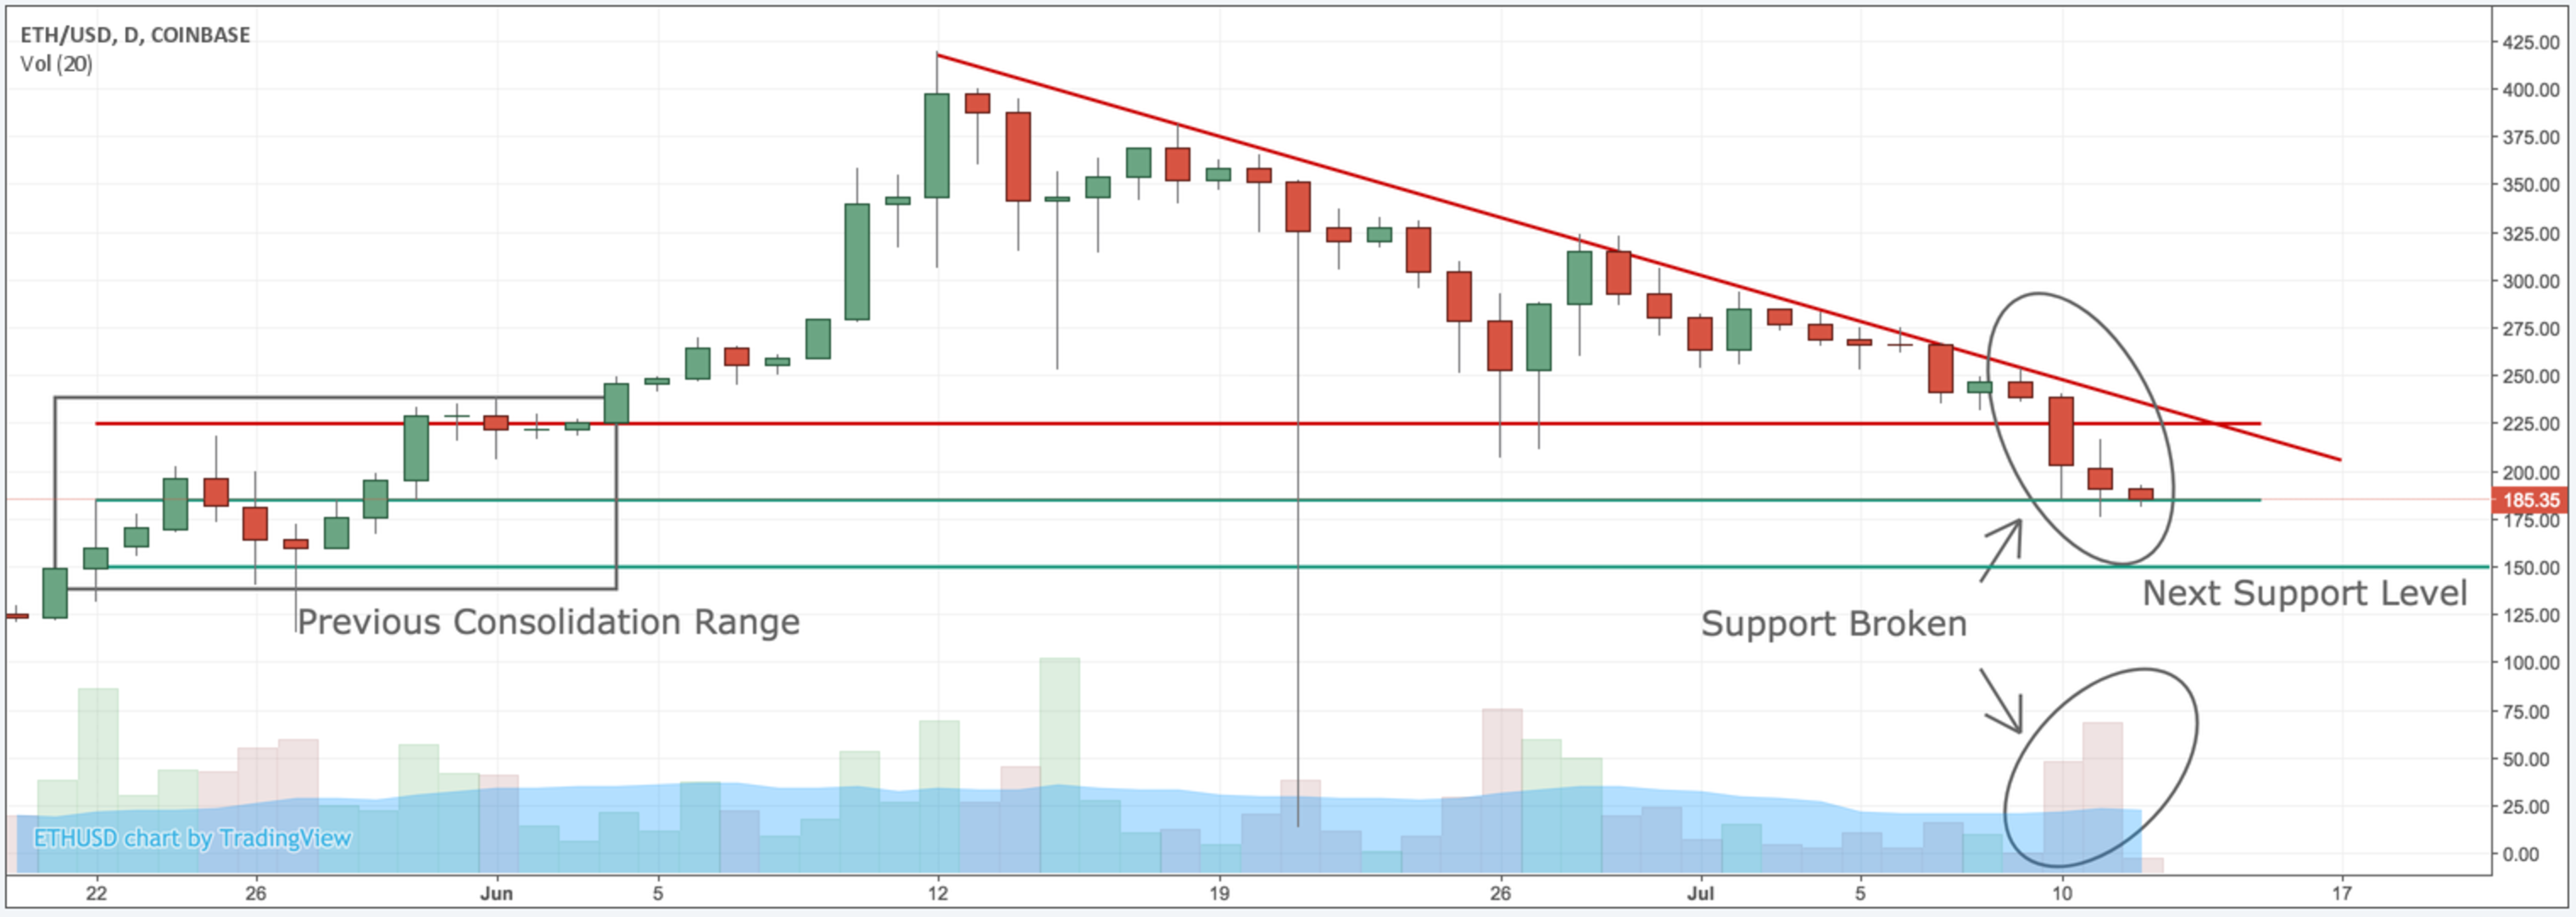
Ethereum price action is confirming bearish sentiment in another day of market-wide selloffs. ETHUSD prices have broken down recently with the broader cryptocurrency selloff, trading below a key support area of $215 and the psychologically important number of $200. However, ETH may find short-term support here at $185 where prices have been consolidating.
ETH has been trading in a descending pennant trading pattern since it briefly traded above $400 on Jun 12th, 2017. Ethereum prices broke below their support price range of $215 and are now pausing at the $185 level.
Six weeks earlier ETH was consolidating at these prices before making new highs. $185 is now acting as support where buyers are starting to come back in.
Let's see how the next few days play out, but if another day of selling comes we may see ETH trading as low as $150. We would continue to be strong buyers at those prices. We are still long-term bullish on ETH, but emphasize the speculative and volatile nature of cryptocurrencies.
Let us know your thoughts! Is the sell-off over? @snapcharts

And we've bounced! Back above the $215 resistance level. Let's see if we can push higher tomorrow!
Congratulations @snapcharts! You have completed some achievement on Steemit and have been rewarded with new badge(s) :
Click on any badge to view your own Board of Honor on SteemitBoard.
For more information about SteemitBoard, click here
If you no longer want to receive notifications, reply to this comment with the word
STOP