Bithumb|ETH|Prediction - Chart Analysis Exercise / 빗썸 이더리움 차트분석 [연습]

IMG URL: https://www.tradingview.com/x/BflwFedc
Title: 빗썸 이더리움 차트분석 연습 / BitThumb ETH Chart Analysis Exercise
경고: 본 내용은 차트분석 연습 결과 입니다. 투자 참조 정보로 사용될 수 없습니다.
WARNING: This is a chart analysis exercise. It can not be used as an investment reference.
※ The translation is based on 'Google Translator' and may not be complete.
Note.
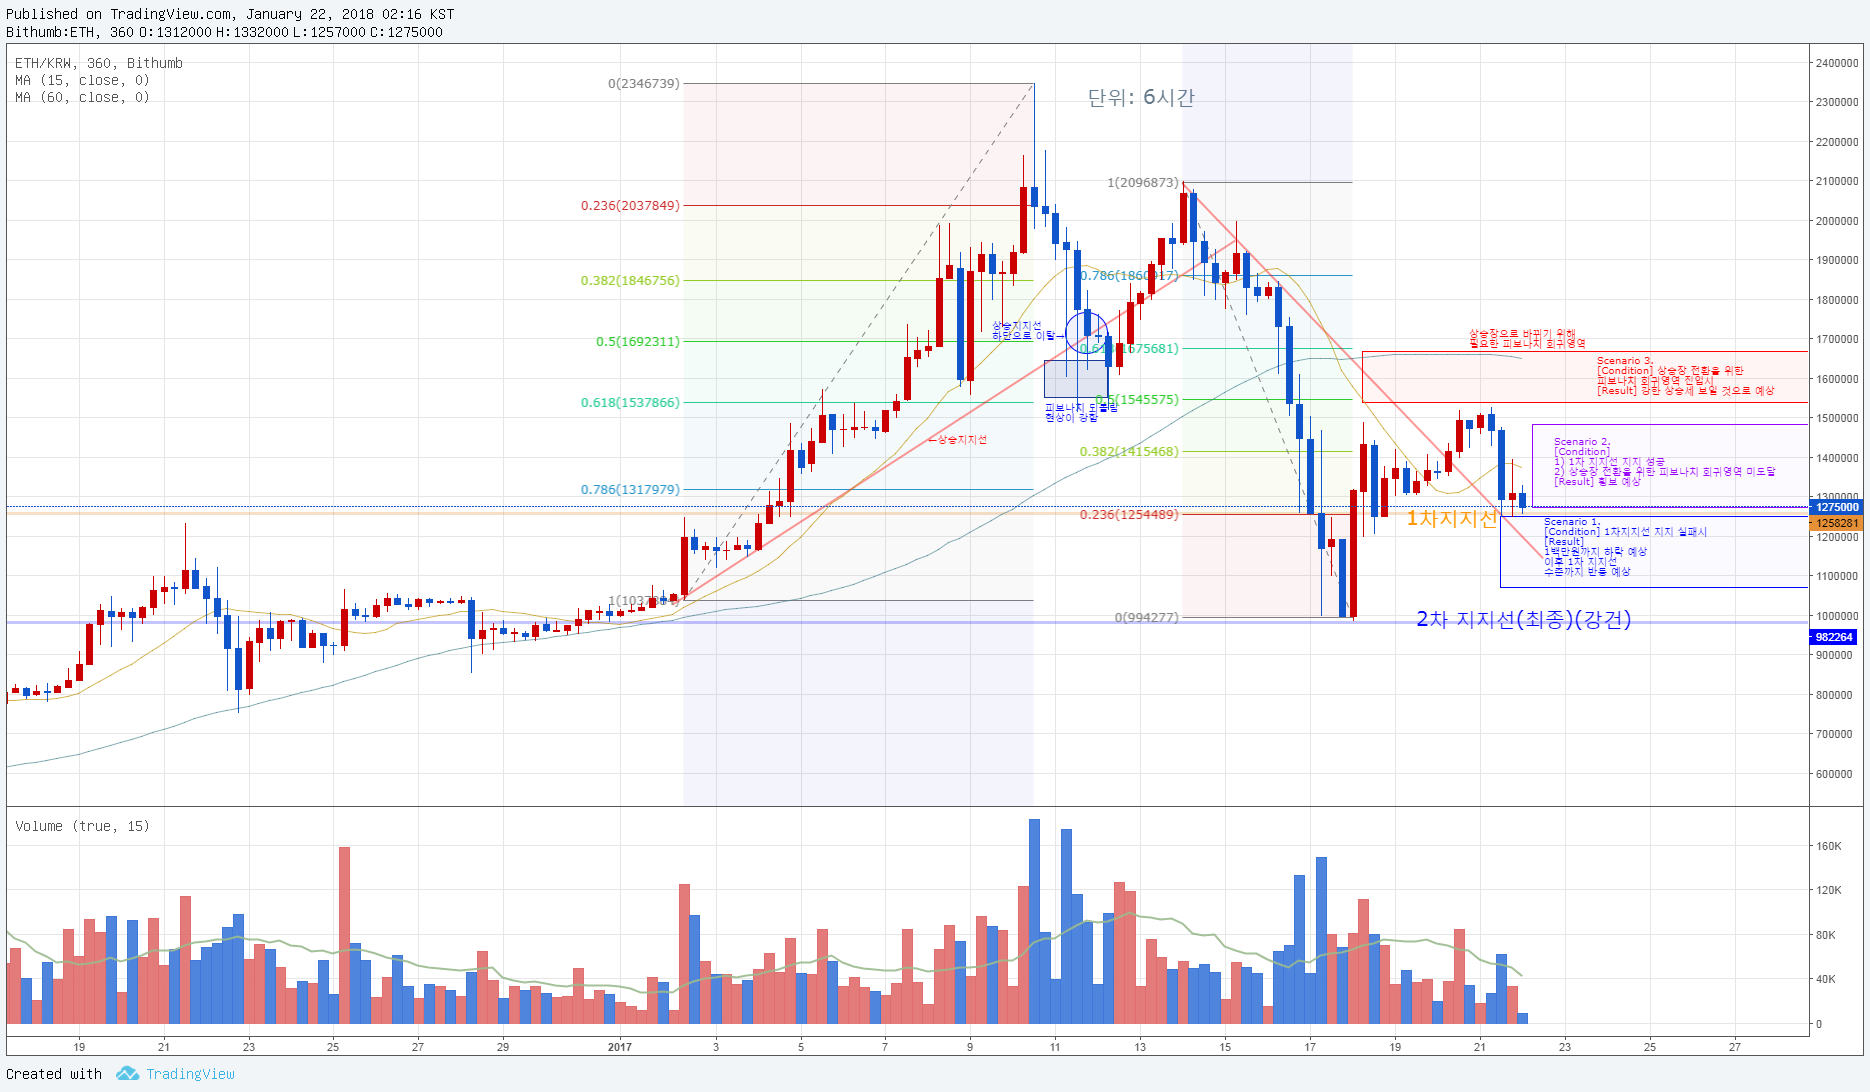
[상황] 126만원 수준에서 지지선 형성됨. 이를 '1차 지지선(주황색 실선)'이라 명명함
[Situation] Support line was formed at the level of KRW 1.26 million. This is called 'primary support line (orange solid line)'.
[Scenario 1]
[Condition] 1차지지선 지지 실패시
[Result] 1백만원까지 하락 예상함. 이후, 1차 지지선 수준까지 반등 예상
[Condition] Failure to hold 'primary support line'.
[Result] Expected to fall to KRW 1 million. It is expected to rebound to the level of primary support line.
Scenario 2.
[Condition]
- 1차 지지선 지지 성공.
- 상승장 전환을 위한 피보나치 회귀영역 미도달.
[Result] 횡보 예상됨.
[Condition] - Successful support of primary support.
- The Fibonacci regression region for the transition of the rising edge is not reached.
[Result] It will make a horizontal report.
Scenario 3.
[Condition] 상승장 전환을 위한 피보나치 회귀영역 진입시.
[Result] 강한 상승세 보일 것으로 예상됨.
[Condition] Upon entering the Fibonacci regression area for the changeover.
[Result] A strong upward trend is expected.
번역기 이용해도 영문 병기는 너무 힘드네요.. 맞는지 검수할 기운도 남아있지 않고.
본 내용은 제가 기록하고 그 결과를 확인하여 차트분석 기술을 자습하기 위한 목적에 있습니다.
이점 유념하시어 투자에 참조하지 않으시길 부탁 드립니다.
I think your analyzing skill grew up.
Thank you.