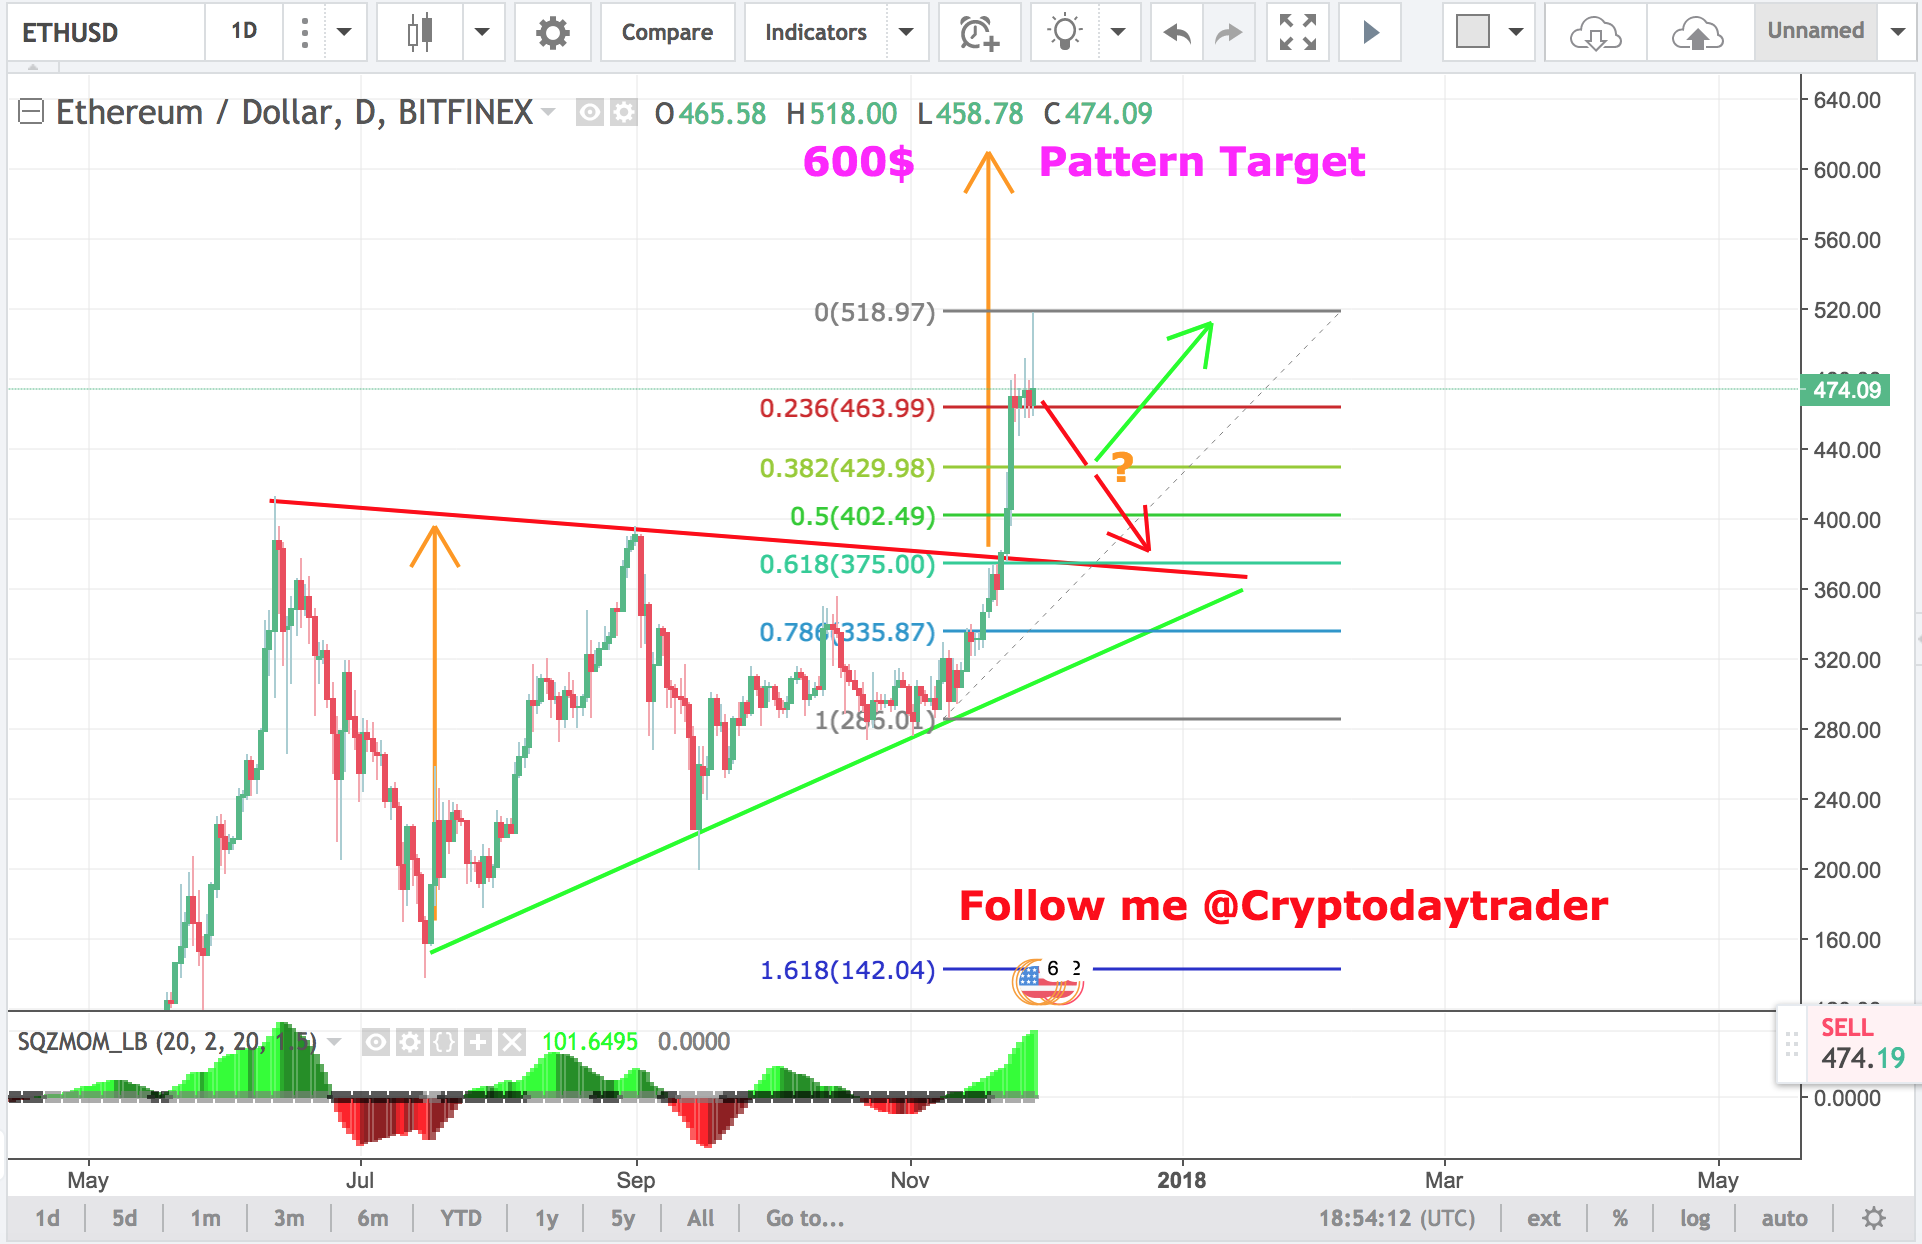
$ETH - Technical Update 29/11 - All time high - Pattern traget 600$
Hello guys,
Back to some chart analysis the $ETH broke his daily triangle pattern since 22/11.
The price target of this pattern should be around 600$

But after today session the momentum is losing power, upside potential seems less probable and consolidation near the 38,2% fibs retracement would be a good entry point.
Other key Technical signals:
The hourly MACD make a negative divergence with a higher high price but not a higher high print on MACD.
The hourly RSI is back to 50, from a top at 73. this is not really bull and show some trend weakness.
Follow me here for more charts: https://steemit.com/@cryptodaytrader!
DISCLAIMER: POST ARE MY OWN OPINION NOT ADVICE TO MAKE ANY KIND OF FINANCIAL INVESTMENTS, INFORMATION ONLY!