ETH breaking the lines again
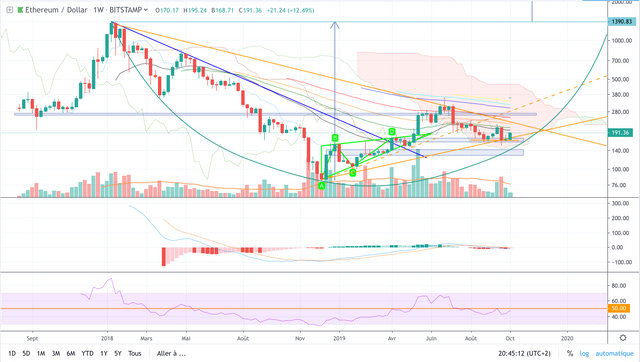
This first image shows a lot if interesting informations. Let's first concentrate on the red rectangle.
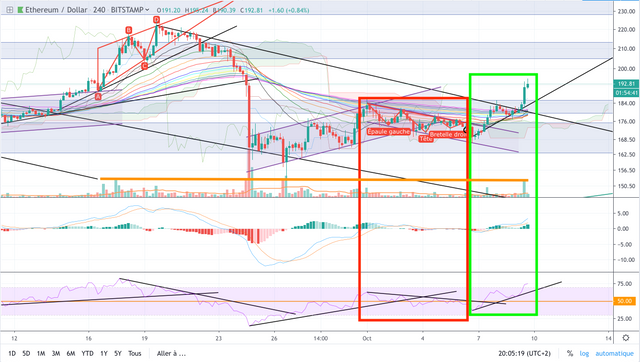
Red rectangle
After evolving into the upward channel, it broke down creating a downward one. But interestingly it formed a very nice H&S. First I thought this would be the signal of the first break up, it wasn't... If we check volumes, they didn't really move and RSI kept a downward slope. However, MACD remained neutral. This may have been the first sign market was preparing for a new move.
Green rectangle
If we now try the same exercice on the green one, we see the price getting up the downward channel. At that point it had my attention. Then it tested the trend line built during the last important upward movement (regarding the hourly and daily basis, let's not forget the cup it formed earlier in the daily chart - it will be following down this article), now it kept my attention, but volumes were still low and MACD only moving slightly upward. And suddenly it broke out after rebound on the newly defined support.
And this time look at the volumes, they finally get interesting. If we compare a little, they go even higher then the ones following the last important break the 16th of February (orange line). RSI is climbing too and MACD finally decided to jump up.
If you now check Fibonacci's EMAs, Price was evolving under them since 24th of September, and it had all de difficulties to cross Ishimoku's cloud until 7th of October.
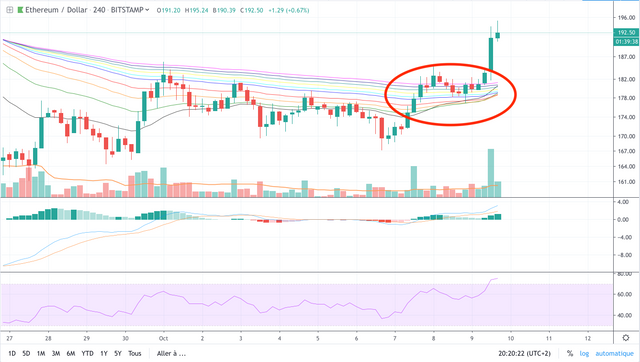
A closer look to Fibonacci's EMAs shows a reversal movement but still not totally complete. If we find signs of entrance in the market, let's maybe keep some reserve out before it is totally confirmed.
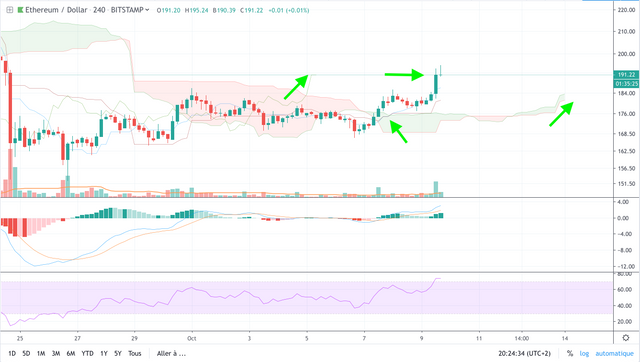
Ishimoku gets here totally positive. Price finally broke above the cloud and Tanken/Sijun, Tanken came over Sijun, Shiku Span is above the cloud, SSA above SSB and both draw an upward pattern.
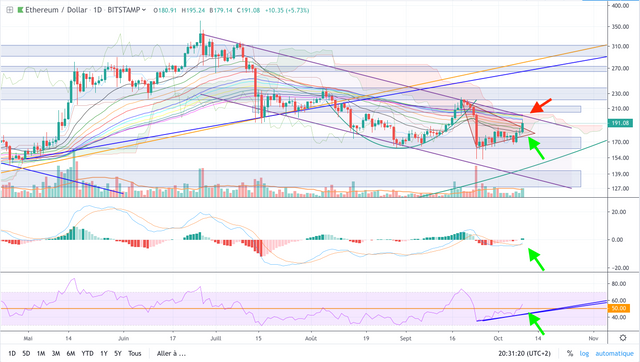
On a daily basis, price left its triangle formation looking to the sky (be aware that the market is still not closed as I am writing at 20h36 the 9th of October, it may continue or come back !), it entered Ichimoku's cloud yesterday and is now evolving within it, and it slowly climbs the ladder of Fibonacci's EMAs. RSI came positive again and MACD just turned up. One point to be aware of is the top of the downward channel, we may not be into the long-term bullish move we all like.
One last view I love to keep in mind is the weekly graph :
I agree this one looks a little messy but still it gives a good picture. So let's clear that view :
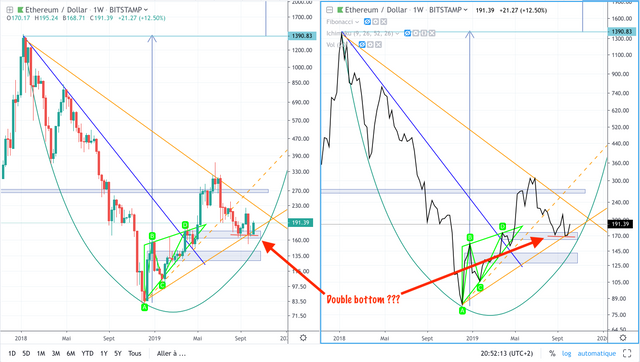
Did we just draw a double bottom ???
Conclusion
On a short term perspective, we may have a small move which we can benefit from now. I'm still waiting for the retest of the trend line that may be inbound at the moment I'm writing this article (volumes came a little backward and price isn't moving really fast). But if it succeeds, I'll take the shot. If then Ishimoku and Fibonacci's EMAs confirm the movement, I'll take it as a sign to reinforce the position.
Still it is important to look at the resistance zone coming around 200$ and just before that the downward channel on the daily basis. But if it breaks, then we may have the sign of a strong reinforcement of positions.
On the weekly chart, the double bottom may be one. This may be the sign of a new very strong move that showing its first signs at the moment on the daily and 4hourly charts.
Important advice : be careful that we often see what we want and not what the price shows. This means : always look for and pay attention to any negative signs that may go against your view of the market, invest with precise goals and if they're achieved then back up a little of the money you made (it is always better to fell you could safely withdraw your first investment and let a smaller part taking off than to lose everything), and set stop losses (you can always adapt them later during the ride, again it is better to have a stop loss that breaks too soon than to lose your investment during the night as you were sleeping).
Stay up-to-date on my free telegram channel in case of any emergency alert : https://t.me/BlessPatrickCryptoUpdate
If you like the articles please don't hesitate to tip as this encourages me to go further and share as much as I can. I am also open to any request on any analysis.